. 2009 Jan 26;184(2):241-52.
doi: 10.1083/jcb.200807019.

Redox amplification of apoptosis by caspase-dependent cleavage of glutaredoxin 1 and S-glutathionylation of Fas

Affiliations

Redox amplification of apoptosis by caspase-dependent cleavage of glutaredoxin 1 and S-glutathionylation of Fas

Vikas Anathy et al. J Cell Biol. .

Abstract

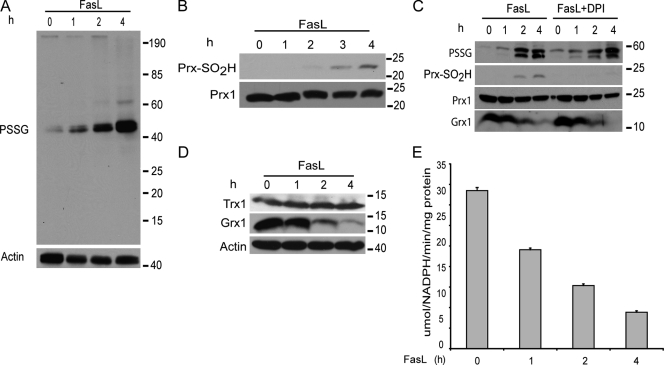
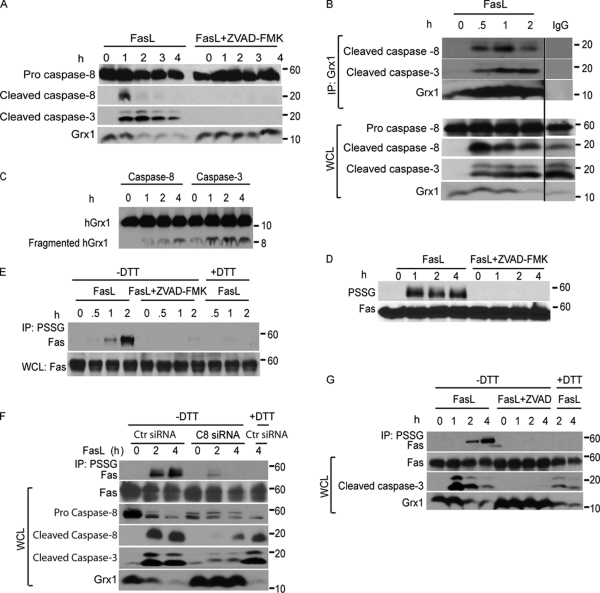
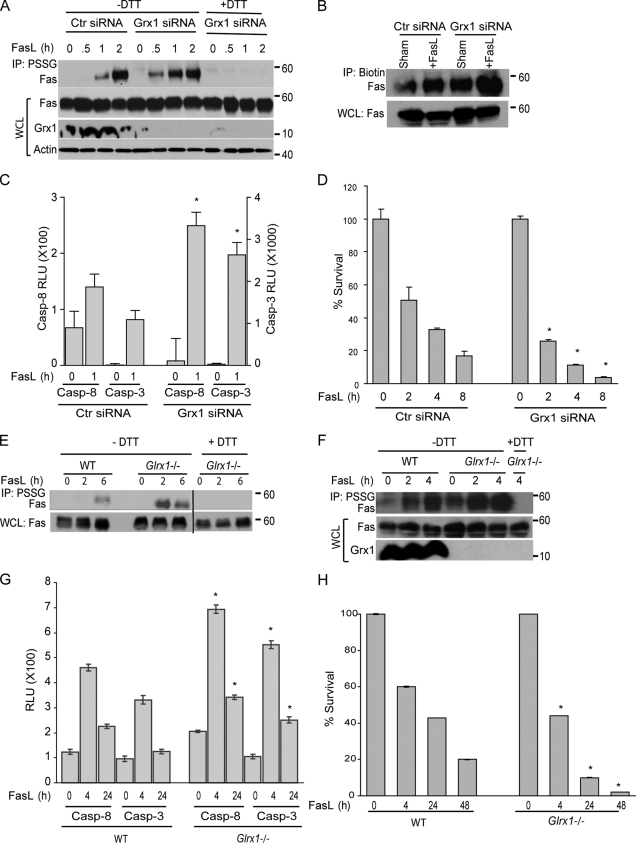
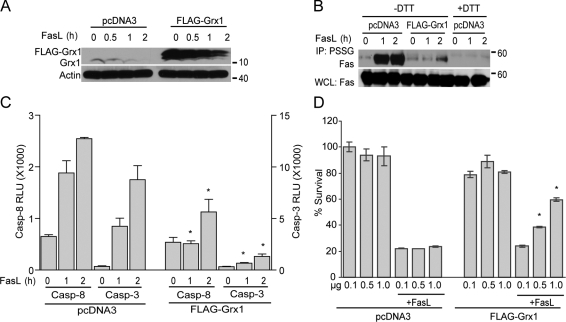
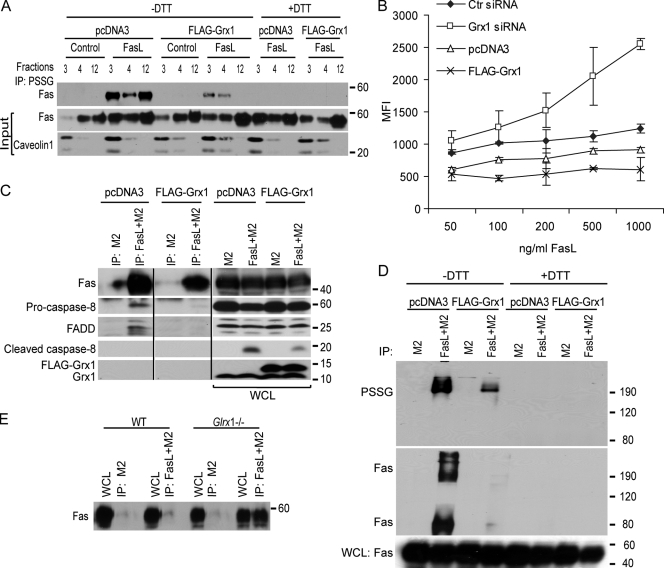
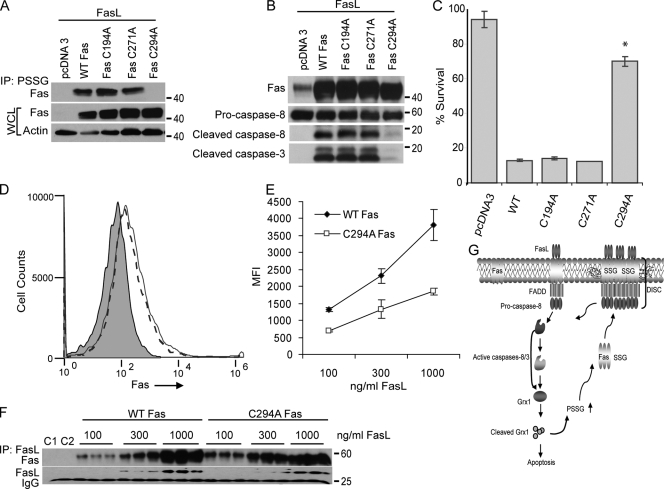
Reactive oxygen species (ROS) increase ligation of Fas (CD95), a receptor important for regulation of programmed cell death. Glutathionylation of reactive cysteines represents an oxidative modification that can be reversed by glutaredoxins (Grxs). The goal of this study was to determine whether Fas is redox regulated under physiological conditions. In this study, we demonstrate that stimulation with Fas ligand (FasL) induces S-glutathionylation of Fas at cysteine 294 independently of nicotinamide adenine dinucleotide phosphate reduced oxidase-induced ROS. Instead, Fas is S-glutathionylated after caspase-dependent degradation of Grx1, increasing subsequent caspase activation and apoptosis. Conversely, overexpression of Grx1 attenuates S-glutathionylation of Fas and partially protects against FasL-induced apoptosis. Redox-mediated Fas modification promotes its aggregation and recruitment into lipid rafts and enhances binding of FasL. As a result, death-inducing signaling complex formation is also increased, and subsequent activation of caspase-8 and -3 is augmented. These results define a novel redox-based mechanism to propagate Fas-dependent apoptosis.


Figures

Figure 1.
Figure 1.
Increases in PSSG and down-regulation of Grx1 in cells stimulated with FasL. (A) Evaluation of PSSG. C10 lung epithelial cells were stimulated with 200 ng/ml FasL + 500 ng/ml cross-linking antibody M2. Cells were harvested at the indicated time points, lysates were resolved on nonreducing SDS-PAGE, and immunoblot analysis was performed using antiglutathione antibody. The bottom panel shows immunoblotting for β-actin as a loading control. (B) Assessment of overoxidation of Prx after ligation of Fas. C10 cells were exposed as described in A, and cell lysates were subjected to SDS-PAGE. The oxidized form of Prx was detected by immunoblot analysis using a specific antibody directed against overoxidized Prx (Prx-SO2H). The bottom panel shows total Prx1 content. (C) Lack of requirement of NADPH oxidase activity in FasL-induced increases in PSSG. C10 cells were treated with FasL in the presence or absence of the inhibitor of 10 µM NADPH oxidase DPI. Lysates were prepared at the indicated times for assessment of PSSG as described in A. Total levels of Prx1, Prx-SO2H, or Grx1 were assessed by immunoblotting. (D) Evaluation of total Grx1 and Trx1 content by immunoblotting in cells exposed to FasL + M2 as described in A. The bottom panel shows β-actin content as a loading control. (E) Evaluation of enzymatic activity of Grx1 in C10 cells exposed to 200 ng/ml FasL + 500 ng/ml M2 for 1–4 h. Results represent triplicate values from two independent experiments. The time-dependent decrease in Grx1 activity was significant at the level of P < 0.05 by Student's t test. Error bars represent SEM.
Figure 2.
Figure 2.
FasL induces caspase-dependent cleavage of Grx1 and increases PSSG as well as S-glutathionylation of Fas. (A) Immunoblot analysis of cleaved caspase-8 (p18) and -3 fragments (p17 and p19) in C10 cells treated with FasL + M2 as described in Fig. 1 in the presence or absence of 10 µM ZVAD-FMK. The bottom panel shows total cellular content of Grx1. Note that expression of the pro form of caspase-8 remains unchanged during the course of the experiment. (B) Evaluation of the interaction between Grx1 and caspase-8 or -3 in cells. C10 cells were exposed to FasL + M2 as described in Fig. 1 A, and Grx1 was immunoprecipitated (IP) at the indicated times for the evaluation of association with active caspase-8 or -3 fragments via Western blotting. The bottom panel represents a Grx1 immunoblot. Lanes on the right represent lysates from cells treated with FasL + M2 for 2 h but were subjected to IgG IP as a reagent control. All samples were run on the same gel, and the lanes were cut and reassembled for consistency. The bottom panels represent total content of proteins in whole cell lysates (WCL) that were used as the input for IP. Note that expression of the pro form of caspase-8 remains unchanged during the course of the experiment. Black line indicates that intervening lanes have been spliced out. (C) In vitro assessment of cleavage of Grx1 by caspase-8 or -3. 200 ng recombinant hGrx1 was incubated with 200 U active caspase-8 or -3. At the indicated times, samples were prepared for immunoblot analysis of hGrx1. Fragmented hGrx1 product is ∼8 kD in size. Incubation of heat-inactivated caspase-8 and -3 with hGrx1 for 4 h largely prevented the formation of cleaved fragment (0 h). (D) Increases in overall PSSG are a response to ligation of Fas and are caspase dependent. Cells were incubated as described in A. ZVAD-FMK or vehicle was added to cells 2 h before ligation of Fas as well as 2 h after ligation. Lysates were resolved by nonreducing SDS-PAGE. Antiglutathione antibody was used to detect PSSG on immunoblots. The bottom panel shows total Fas content. (E) Caspase-dependent S-glutathionylation of Fas. C10 cells were incubated with FasL + M2 for 0.5, 1, or 2 h in the presence or absence of ZVAD-FMK. Cell lysates were subjected to nonreducing IP (−DTT) using antiglutathione antibody to IP S-glutathionylated proteins (IP: PSSG) before detection of Fas via Western blotting. As a reagent control to reduce S-glutathionylated proteins before IP, samples were incubated with 50 mM DTT (+DTT). The bottom panel represents Fas content in cell lysates. (F) S-glutathionylation of Fas requires the presence of caspase-8. C10 cells were transfected with control (Ctr) siRNA or caspase-8 (C8)–specific siRNA and 48 h later were incubated with FasL + M2 for 2 or 4 h. The top lane shows assessment of S-glutathionylation of Fas via IP of S-glutathionylated proteins using antiglutathione antibody (IP: PSSG) under nonreducing conditions (−DTT) before detection of Fas via Western blotting. As a reagent control to reduce S-glutathionylated proteins before IP, samples were incubated with 50 mM DTT (+DTT). The bottom panels show total content of Fas, procaspase-8, cleaved caspase-8, cleaved caspase-3, and Grx1 in whole cell lysates. (G) Assessment of caspase-dependent degradation of Grx1 and S-glutathionylation of Fas in NIH 3T3 cells after ligation of Fas. Cells were treated with 500 ng/ml FasL + 1 µg/ml M2 for 1, 2, or 4 h in the presence or absence of ZVAD-FMK. S-glutathionylated proteins were immunoprecipitated as described in E before detection of Fas via Western blotting. The bottom panel represents Fas content, cleaved caspase-3, and Grx1 content in whole cell lysates.
Figure 3.
Figure 3.
Increased S-glutathionylation of Fas, caspase-8 activity, and cell death in cells lacking Grx1. (A) Assessment of S-glutathionylation of Fas after knockdown of Grx1. C10 cells were transfected with Grx1 siRNA or control (Ctr) siRNA and treated with FasL + M2 for the indicated times. S-glutathionylated proteins were immunoprecipitated using antiglutathione antibody (IP: PSSG). Samples treated with 50 mM DTT to reduce S-glutathionylated proteins (+DTT) were used as reagent controls. The content of Fas, Grx1, and actin in whole cell lysates (WCL) used as the input for IP are shown in the bottom panels. (B) Assessment of S-glutathionylation of Fas after loading of cells with biotinylated glutathione. siRNA-transfected cells were labeled with 5 mM biotinylated glutathione ethyl ester for 1 h before treatment with FasL. After 2 h of FasL + M2 treatment, glutathionylated proteins in lysates were immunoprecipitated using antibiotin antibody followed by immunoblot detection of Fas. The bottom panel shows total Fas expression in whole cell lysates as a loading control. (C) Evaluation of caspase-8 and -3 enzymatic activities in cells after knockdown of Grx1. C10 cells were transfected with control or Grx1 siRNA before stimulation with FasL + M2 for 1 h, and lysates were prepared for evaluation of caspase activity. Results are expressed as mean + SEM relative luminescence units (RLU)/20,000 cells. The graph represents triplicate values obtained from two independent experiments. *, P < 0.05 compared with respective control siRNA groups (ANOVA). (D) Impact of Grx1 knockdown on cell survival. Cells were transfected with control or Grx1 siRNA and exposed as described in A. Cell survival was assessed using the MTT assay. Results are expressed at a percent of survival compared with respective untreated control groups and are presented as mean values + SEM of triplicate values obtained from two independent experiments. Note that survival in the Grx1 siRNA–treated cells was 11% lower than the control siRNA–treated cells in the absence of stimulation with FasL. *, P < 0.05 compared with respective control siRNA groups (ANOVA). (E) Assessment of S-glutathionylation of Fas in lung fibroblasts lacking Glrx1. WT or Glrx1−/− cells were exposed to FasL + M2 for the indicated times, and S-glutathionylation of Fas was determined as described in A. All samples were run on the same gel, and the lanes were cut and reassembled for consistency. Note that S-glutathionylation of Fas in these primary cells is relatively protracted compared with results obtained in the C10 cell line. Black line indicates that intervening lanes have been spliced out. (F) Assessment of S-glutathionylation of Fas in CD4+ T lymphocytes lacking Glrx1. WT or Glrx1−/− cells were exposed to FasL + M2 for the indicated times, and S-glutathionylation of Fas was determined as in A. The bottom panels show content of Fas and Grx1 in whole cell lysates. (G) Caspase-8 and -3 activities in primary lung fibroblasts isolated from WT or Glrx1−/− mice in response to exposure to FasL + M2 for the indicated times. Results are expressed as mean ± SEM relative luminescence units (RLU)/20,000 cells. The graph represents triplicate values obtained from two independent experiments. *, P < 0.05 compared with respective WT groups (ANOVA). Note that activation of caspases in these primary cells is relatively protracted compared with results obtained in the C10 cell line. (H) Comparative assessment of FasL-induced cell death in WT or Glrx1−/− primary lung fibroblasts. Cells were exposed as indicated, and survival was assessed using the MTT assay. Results are expressed as a percent of survival compared with respective untreated control groups and are presented as mean values + SEM of triplicate values obtained from two independent experiments. Note that survival in the Glrx1−/− cells was 13% lower than their WT counterparts in the absence of stimulation with FasL. *, P < 0.05 compared with the WT FasL-treated group (ANOVA). Note that FasL-induced cell death in the primary cells is relatively protracted compared with results obtained in the C10 cell line.
Figure 4.
Figure 4.
Overexpression of Grx1 decreases S-glutathionylation of Fas, caspase-8 and -3 activities, and cell death. (A) Assessment of Grx1 expression. C10 cells were transfected with pcDNA3 or Flag-Grx1 plasmids (1 µg/4 × 105 cells). Cells were stimulated with FasL + M2 for 2 h, and lysates were analyzed by immunoblotting for Grx1 expression. The bottom panel shows β-actin as a loading control. (B) Assessment of S-glutathionylation of Fas after overexpression of Grx1. pcDNA3 or Flag-Grx1–transfected cells were stimulated with FasL + M2, and after 2 h, S-glutathionylated proteins were immunoprecipitated using an antibody directed against glutathione (IP: PSSG). +DTT samples were used as reagent controls. The bottom panel represents Fas content in whole cell lysates (WCL). (C) Assessment of caspase-8 and -3 activities in cells after overexpression of Grx1. C10 cells were transfected with pcDNA3 or Flag-Grx1 plasmids and stimulated with FasL + M2. At the indicated times, cells were harvested, and lysates were prepared for evaluation of caspase activity. Results are expressed as mean ± SEM relative luminescence units (RLU)/20,000 cells. The graph represents triplicate values obtained from two independent experiments. *, P < 0.05 compared with FasL-treated pcDNA3-treated control groups (ANOVA). (D) Assessment of FasL-induced death in cells overexpressing Grx1. Cells were transfected with the indicated amounts of pcDNA3 or Flag-Grx1 plasmid (total DNA content 1.25 µg/4 × 105 cells) and stimulated with FasL + M2. After 2 h, cell survival was assessed using the MTT assay. Results represent triplicate values (mean ± SEM) from two independent experiments. *, P < 0.05 compared with the pcDNA3-transfected group (Student's t test).
Figure 5.
Figure 5.
Assessment of FasL binding, presence of Fas in lipid rafts, and DISC formation after manipulation of Grx1. (A) Evaluation of S-glutathionylation of Fas in lipid rafts in cells stimulated with FasL + M2 and the impact of overexpression of Grx1. Cells were transfected with pcDNA3 or Flag-Grx1 and stimulated with FasL + M2 for 20 min. Lipid raft fractions (3 and 4) and soluble fraction (12) were subjected to IP with antiglutathione antibody and analyzed by immunoblotting for Fas. PSSG was decomposed with 50 mM DTT as a reagent control before IP. The middle and bottom panels reflect immunoblot assays of Fas and the raft marker caveolin1 present in the input samples. Complete fractionation is shown in Fig. S3 A (available at http://www.jcb.org/cgi/content/full/jcb.200807019/DC1). (B) Assessment of FasL binding to cells after manipulation of Grx1. Cells were subjected to control (Ctr) and Grx1 siRNA transfection. In separate experiments, cells were transfected with pcDNA3 or Grx1 plasmids. After 48 h, cells were trypsinized and incubated with ascending doses of FasL + M2 for 20 min. Binding of FasL to cells was evaluated after incubation with FITC-conjugated anti–mouse antibody and evaluation of 10,000 events via flow cytometry. Binding of FasL to cells is reflected as mean fluorescence intensity (MFI), and absolute values are plotted on the y-axis. The x-axis depicts ascending concentrations of FasL. Note that differences absolute fluorescence intensities between pcDNA3 and control siRNA–transfected cells may be a result of the different transfection procedures. Confirmation of Grx1 overexpression and knockdown is shown in Fig. S3 B and Fig. S3 C, respectively. (C) Assessment of FasL-interacting proteins in cells overexpressing Grx1. pcDNA3 or Grx1-transfected C10 cells were treated with M2 alone or FasL + M2. Cells were lysed, and 700 µg of protein was subjected to IP using protein G agarose beads to isolate DISC proteins. After SDS-PAGE, samples were analyzed by immunoblotting for Fas, FADD, procaspase 8, cleaved caspase-8, and Grx1. IP, M2 represents control IP in the absence of FasL. Note that all samples were run on the same gel. Black lines indicate that intervening lanes have been spliced out. (D) Evaluation of PSSG and Fas content in high MW complexes after IP of FasL + M2 or M2 alone via nonreducing SDS PAGE. As a control, samples were treated with DTT before electrophoresis. (E) Assessment of interaction between FasL and Fas in WT primary tracheal epithelial cells or cells lacking Glrx1. Cells were exposed to M2 alone or FasL + M2 for 30 min, lysed, and 700 µg of protein was subjected to IP using protein G agarose beads. After SDS-PAGE, samples were analyzed by immunoblotting for Fas. WCL, whole cell lysate.
Figure 6.
Figure 6.
S-glutathionylation of cysteine 294 of Fas promotes binding to FasL, activation of caspase-8 and -3, and cell death. (A) lpr lung fibroblasts were transfected with pcDNA3, WT Fas, or Fas mutant constructs C194A, C271A, or C294A. Cells were exposed to FasL + M2 for 2 h, and lysates were subjected to IP using antiglutathione antibody. Immunoprecipitates were subjected to SDS-PAGE, and Fas content was evaluated via immunoblotting. The middle and bottom panels show total content of Fas and β-actin in whole cell lysates (WCL) as controls. (B) Attenuation of the formation of cleaved caspase-8 and -3 fragments in cells expressing Fas C294A. Cells were transfected with pcDNA3, WT, or Fas mutant constructs before incubation with FasL + M2. Lysates were subjected to immunoblotting using anti–caspase-8 and -3 antibodies. Fas immunoblotting (top) confirms equal expression of Fas constructs. (C) Protection against death in cells expressing C294A mutant Fas. lpr lung fibroblasts were transfected and treated as described in A, and cell survival was assessed using the MTT assay. Percent survival was calculated from two independent experiments run in triplicates. Results are expressed as mean values ± SEM. *, P < 0.05 as compared with cells transfected with WT Fas (Student's t test). Confirmation that all constructs are expressed equally is demonstrated in Fig. S4 A (available at http://www.jcb.org/cgi/content/full/jcb.200807019/DC1). (D) S-glutathionylation of Fas does not affect surface expression. lpr lung fibroblasts were transfected with WT Fas or C294A mutant construct, and surface expression of Fas was evaluated 48 h after transfection using anti-Fas antibody (JO2) via flow cytometry. Log Fas immunofluorescence is shown on the x-axis, and cell counts are shown on the y-axis. pcDNA3 control (gray) reflects nonspecific background fluorescence. The dashed line represents C294A mutant Fas, and the solid line indicates WT Fas. Confirmation that both constructs are expressed equally is included in Fig. S4 B. (E) Assessment of FasL binding to lpr lung fibroblasts that express WT or C294A mutant Fas constructs. 48 h after transfection, cells were trypsinized and incubated with ascending doses of FasL + M2 for 20 min. Binding of FasL to cells was evaluated after incubation with FITC-conjugated anti–mouse antibody and evaluation of 10,000 events via flow cytometry. Binding of FasL to cells is reflected as mean fluorescence intensity (MFI), and absolute values are plotted on the y-axis. The x-axis depicts ascending concentrations of FasL. Confirmation that both constructs are expressed equally is included in Fig. S4 B. Error bars indicate ± SEM. (F) Assessment of binding of WT Fas or C294A mutant Fas in the absence of PSSG. lpr lung fibroblasts were transfected with WT or C294A mutant Fas constructs (Fig. S4 C). 48 h after transfection, whole cell lysates were prepared and incubated with 100, 300, or 1,000 ng/ml FasL + 2 µg/ml M2 at 4°C for 12–16 h. Samples were subsequently incubated with protein G agarose beads and washed several times before assessment of Fas content via Western Blot analysis. C1 represents sample from WT Fas–expressing cells subjected to IP with M2 antibody alone, whereas C2 represents sample from lpr cells transfected with pcDNA3 subjected to IP with 100 ng/ml FasL + 2 µg/ml M2. The bottom panel shows content of FasL. IgG, nonspecific reactivity. (G) Proposed model that incorporates S-glutathionylation in Fas-dependent apoptosis. In response to Fas ligation, activated caspase-8 and/or -3 degrade Grx1 either directly or potentially via indirect mechanisms. Caspase-initiated decreases in Grx1 content causes S-glutathionylation of Fas at cysteine 294 to increase. This promotes binding of FasL and enhances aggregation of Fas and its accumulation in lipid rafts and formation of the DISC, thereby further enhancing caspase activities and apoptosis. S-glutathionylation of Fas provides a mechanism whereby the extent of cell death is amplified in a feed-forward regulatory loop.

References

    1. Benhar M., Forrester M.T., Hess D.T., Stamler J.S. 2008. Regulated protein denitrosylation by cytosolic and mitochondrial thioredoxins.Science. 320:1050–1054 - PMC - PubMed
    1. Chakrabandhu K., Herincs Z., Huault S., Dost B., Peng L., Conchonaud F., Marguet D., He H.T., Hueber A.O. 2007. Palmitoylation is required for efficient Fas cell death signaling.EMBO J. 26:209–220 - PMC - PubMed
    1. Daily D., Vlamis-Gardikas A., Offen D., Mittelman L., Melamed E., Holmgren A., Barzilai A. 2001. Glutaredoxin protects cerebellar granule neurons from dopamine-induced apoptosis by dual activation of the ras-phosphoinositide 3-kinase and jun n-terminal kinase pathways.J. Biol. Chem. 276:21618–21626 - PubMed
    1. Drappa J., Brot N., Elkon K.B. 1993. The Fas protein is expressed at high levels on CD4+CD8+ thymocytes and activated mature lymphocytes in normal mice but not in the lupus-prone strain, MRL lpr/lpr.Proc. Natl. Acad. Sci. USA. 90:10340–10344 - PMC - PubMed
    1. Earnshaw W.C., Martins L.M., Kaufmann S.H. 1999. Mammalian caspases: structure, activation, substrates, and functions during apoptosis.Annu. Rev. Biochem. 68:383–424 - PubMed

Publication types