. 2009 Feb;133(2):151-69.
doi: 10.1085/jgp.200810089.

Decremental response to high-frequency trains of acetylcholine pulses but unaltered fractional Ca2+ currents in a panel of "slow-channel syndrome" nicotinic receptor mutants

Affiliations

Decremental response to high-frequency trains of acetylcholine pulses but unaltered fractional Ca2+ currents in a panel of "slow-channel syndrome" nicotinic receptor mutants

Sergio Elenes et al. J Gen Physiol. 2009 Feb.

Abstract

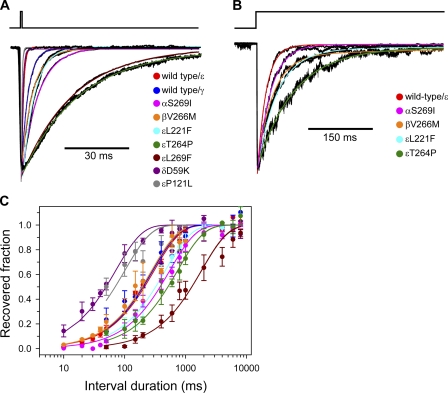
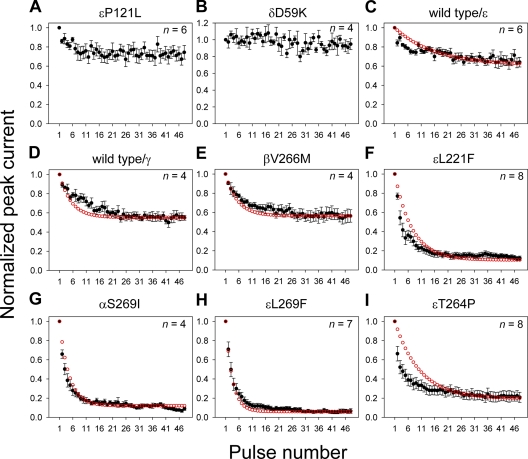
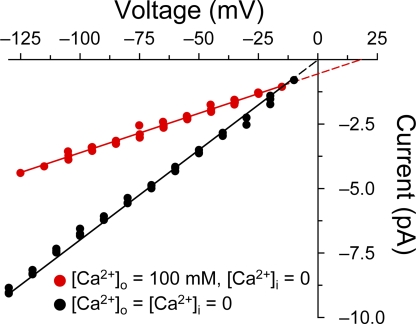
The slow-channel congenital myasthenic syndrome (SCCMS) is a disorder of the neuromuscular junction caused by gain-of-function mutations to the muscle nicotinic acetylcholine (ACh) receptor (AChR). Although it is clear that the slower deactivation time course of the ACh-elicited currents plays a central role in the etiology of this disease, it has been suggested that other abnormal properties of these mutant receptors may also be critical in this respect. We characterized the kinetics of a panel of five SCCMS AChRs (alphaS269I, betaV266M, epsilonL221F, epsilonT264P, and epsilonL269F) at the ensemble level in rapidly perfused outside-out patches. We found that, for all of these mutants, the peak-current amplitude decreases along trains of nearly saturating ACh pulses delivered at physiologically relevant frequencies in a manner that is consistent with enhanced entry into desensitization during the prolonged deactivation phase. This suggests that the increasingly reduced availability of activatable AChRs upon repetitive stimulation may well contribute to the fatigability and weakness of skeletal muscle that characterize this disease. Also, these results emphasize the importance of explicitly accounting for entry into desensitization as one of the pathways for burst termination, if meaningful mechanistic insight is to be inferred from the study of the effect of these naturally occurring mutations on channel function. Applying a novel single-channel-based approach to estimate the contribution of Ca(2+) to the total cation currents, we also found that none of these mutants affects the Ca(2+)-conduction properties of the AChR to an extent that seems to be of physiological importance. Our estimate of the Ca(2+)-carried component of the total (inward) conductance of wild-type and SCCMS AChRs in the presence of 150 mM Na(+), 1.8 mM Ca(2+), and 1.7 mM Mg(2+) on the extracellular side of cell-attached patches turned out be in the 5.0-9.4 pS range, representing a fractional Ca(2+) current of approximately 14%, on average. Remarkably, these values are nearly identical to those we estimated for the NR1-NR2A N-methyl-d-aspartate receptor (NMDAR), which has generally been considered to be the main neurotransmitter-gated pathway of Ca(2+) entry into the cell. Our estimate of the rat NMDAR Ca(2+) conductance (using the same single-channel approach as for the AChR but in the nominal absence of extracellular Mg(2+)) was 7.9 pS, corresponding to a fractional Ca(2+) current of 13%.


Figures

Figure 1.
Figure 1.
A reaction mechanism for the muscle AChR. C, O, and D denote the closed, open, and desensitized conformations of the channel, respectively, whereas A denotes a molecule of ACh. The red arrows identify the subset of rate constants that, according to Eq. 1, determine the kinetics of the macroscopic current decay through the muscle AChR during channel deactivation (or, equivalently, the mean duration of a burst of single-channel diliganded openings). The states indicated in red (CA2 and OA2) are those that would interconvert during a burst of diliganded openings.
Figure 2.
Figure 2.
Calibration of the solution-switching system. The different parameters of the solution-switching system (that is, diameter of the theta tube openings, relative positioning of the theta tube and patch pipette, rate of solution flow, and bandwidth of the computer-generated waveform) were adjusted so as to optimize the time course of the solution exchange. The latter was estimated by measuring the liquid-junction potential by alternatively exposing the tip of an open pipette (containing 150 mM K-aspartate and 20 mM KCl) to 1 M KCl (for 0.8 ms) and 150 mM KCl (for 10 ms) solutions. (A) Representative train of 93 pulses of 1 M KCl delivered at ∼100 Hz. (B) The train in A was segmented into two-pulse segments, and these were aligned and averaged (red trace). (C) The first half of the traces in B is magnified to emphasize the rise time during the onset and the offset, as well as the duration of each pulse.
Figure 3.
Figure 3.
Kinetics of mouse muscle AChR deactivation, entry into desensitization, and recovery from desensitization. (A) Kinetics of deactivation. Each plotted trace is the average response of a patch to several 0.8-ms pulses of ACh (100 such pulses for εP121L, 5 for εL269F, and 10 for all other constructs) applied as low-frequency trains. The deactivation time constants, estimated from mono-exponential fits to the decaying phase of these plots, were in turn averaged over several such trains and are listed in Table I. (B) Kinetics of entry into desensitization. For clarity, only the responses of some of the studied constructs to the 2-s pulses of ACh are shown. Only the first 450 ms of these responses are displayed. The parameters estimated from the exponential fits to the decaying phase of these time courses were used to calculate desensitization half-times (see Materials and methods). The corresponding averages, over several responses per construct, are listed in Table I. (C) Kinetics of recovery from desensitization estimated using pairs of conditioning (1-s) and test (100-ms) pulses of ACh. The color key is the same as in A. Vertical error bars are standard errors calculated from the results of several independent experiments. The time constants of mono-exponential rise fits to the plots of recovered fraction as a function of the duration of the interpulse intervals (see Materials and methods) are listed in Table I. The concentration of ACh applied during the pulses, in all three panels, was 1 mM in the case of the severe loss-of-function εP121L mutant and 100 µM in all other cases.
Figure 4.
Figure 4.
Slow-channel syndrome AChRs desensitize during deactivation. (A–I) Example current traces recorded from individual outside-out patches. Each panel shows the response of a different mouse muscle AChR construct to the application of a 50-Hz train of 0.8-ms ACh pulses (1 mM in A and 100 µM in B–I). One such train is indicated in A above the current trace. The zero-current level is indicated, on each trace, with a dotted line. The plots are presented in increasing order of deactivation time constant (Table I). The prediction (made on the basis of the kinetic scheme in Fig. 1 and Eq. 1) that the slower the deactivation time course the more pronounced the depression is borne out by these recordings. Of course, because the kinetics of entry into and recovery from desensitization are not completely unaffected by the mutations (Table I), this relationship cannot be perfect. However, the trend is undoubtedly clear (see also Fig. 5).
Figure 5.
Figure 5.
Depression of ACh-evoked currents upon repetitive stimulation. (A–I) Peak-current values in response to 50-Hz trains of 0.8-ms ACh pulses were normalized with respect to the first peak in each series and averaged across replicate experiments. The number of averaged responses (n) is indicated for each construct. Vertical error bars are standard errors. Example current traces are given in Fig. 4. The red circles correspond to the fits from which estimates of the rate of recovery from desensitization within a train of ACh pulses were obtained (see Materials and methods). These values are expressed as time constants in Table I. These fits were performed only for the wild-type and gain-of-function mutant AChRs.
Figure 6.
Figure 6.
Frequency dependence of the AChR response to trains of ACh pulses. (A and B) Normalized current responses of two slow-channel syndrome mutants to trains of 0.8-ms pulses of 100 µM ACh delivered at different frequencies. The responses to several trains at each frequency were averaged. Vertical error bars are standard errors. In A, the number of averaged trains was 3 at 2.5, 5 and 10 Hz, 10 at 25 Hz, and 8 at 50 and 100 Hz. In B, the number of averaged trains was 6 at 2.5 and 10 Hz, 5 at 5 Hz, 14 at 25 Hz, 8 at 50 Hz, and 7 at 100 Hz. The y-axis value corresponding to the first pulse in each train (black symbol) is the same for all trains.
Figure 7.
Figure 7.
Mimicking the heterozygous state of a slow-channel mutation. Normalized current responses of outside-out patches excised from cells expressing a mixture of both wild-type and L269F ε-subunits (along with all other mouse muscle AChR wild-type subunits) to trains of 0.8-ms pulses of 100 µM ACh delivered at 50 Hz. In these experiments, each train consisted of 100 pulses. Vertical error bars are standard errors. The responses to five trains were averaged.
Figure 8.
Figure 8.
Comparison of the kinetics of AChR deactivation, entry into desensitization, and recovery from desensitization in human and mouse muscle wild-type AChRs. (A) Kinetics of deactivation. Each plotted trace is the average response of a patch to 10 0.8-ms pulses of 100 µM ACh applied as low-frequency trains. Only the decaying phase is displayed to emphasize the slower decay time course of the human receptor. (B) Kinetics of entry into desensitization. Only the first ∼125 ms of these responses to 100 µM ACh are displayed. The color key is the same as in A. (C) Kinetics of recovery from desensitization estimated using pairs of conditioning (1-s) and test (100-ms) pulses of 100 µM ACh. Vertical error bars are standard errors calculated from the results of several independent experiments. The color key is the same as in A. All kinetic parameters were estimated as indicated in Materials and methods.
Figure 9.
Figure 9.
Depression of ACh-evoked currents through human and mouse muscle wild-type AChRs. (A) Example current trace recorded from an outside-out patch containing human muscle wild-type AChRs exposed to a 50-Hz train of 0.8-ms ACh pulses (100 µM). The train of pulses is indicated above the current recording. (B) Peak-current values in response to the applied 50-Hz trains were normalized with respect to the first peak in each series and averaged across replicate experiments (six for the mouse AChR and seven for the human counterpart). Vertical error bars are standard errors. The orange circles superimposed on the human AChR data points correspond to the fit from which the estimate of the rate of recovery from desensitization within a train of ACh pulses was obtained (see Materials and methods). The corresponding fit to the mouse AChR data points is shown in Fig. 5.
Figure 10.
Figure 10.
150 mM Na+ saturates the permeation pathway of the AChR and the NMDAR. I-V curves recorded in the cell-attached configuration with either 150 or 600 mM NaCl in the pipette solution. For both channels, the pipette solution was pH buffered with 10 mM HEPES/KOH, pH 7.4, and was nominally Ca2+ and Mg2+ free. (A) Adult mouse wild-type AChR. γ150 mM NaCl = 89 ± 0.6 pS; γ600 mM NaCl = 96 ± 0.5 pS. (B) NR1-NR2A rat wild-type NMDAR. γ150 mM NaCl = 81 ± 0.5 pS; γ600 mM NaCl = 89 ± 0.5 pS. To facilitate the visual comparison of slopes, each I-V relationship was displaced along the voltage axis so that it extrapolates to the origin. As expected from nonselective cation channels, the cell-attached curves recorded in the presence of 600 mM NaCl in the pipette were shifted to the right of those recorded with 150 mM NaCl.
Figure 11.
Figure 11.
I-V curves recorded in the cell-attached configuration at different values of extracellular [Ca2+]. The color code is the same for all panels and is shown in A in terms of Ca2+ concentration ([Ca2+]o), rather than Ca2+ activity ( aCao2+ ). In all cases, the pipette solution also contained 150 mM NaCl (and 10 mM HEPES/KOH, pH 7.4), but only in the case of the wild-type and mutant AChRs did it also contain 1.7 mM MgCl2. The pipette solution used for recordings from the NMDAR was nominally Mg2+ free. Recordings from the NMDAR displayed occasional sojourns in an open-channel level of lower conductance, which were excluded from the analysis. Measured current values were fitted as a function of both voltage and aCao2+ using Eqs. 2–4, and the values of the estimated parameters are listed in Table II. Hence, the plotted continuous lines are not linear fits to the individual I-V curves. For data fitting, [Ca2+]o values were expressed as the corresponding Ca2+ activities following the work of Butler (1968). Before being fitted, each I-V relationship was displaced along the voltage axis so that it extrapolates to the origin; this was needed to apply Eqs. 2–4. Each panel was fitted independently. The total number of current-voltage- aCao2+ data points in each panel was: 496 in A, 657 in B, 507 in C, 490 in D, 420 in E, 557 in F, 444 in G, 532 in H, and 409 in I.
Figure 12.
Figure 12.
Representative single-channel cell-attached current traces recorded at different values of extracellular [Ca2+]. (A) Adult mouse wild-type AChR. (B) Adult mouse AChR harboring the εL269F mutation. In addition to the indicated concentration of Ca2+ (as CaCl2), the pipette solution also contained the following (in mM): 150 NaCl, 1.7 MgCl2, and 10 HEPES/KOH, pH 7.4. Applied potential = −100 mV (negative inside the cell). [ACh] ≅ 1 µM. Display fc ≅ 6 kHz. The zero-current level is indicated on each trace with a dotted line.
Figure 13.
Figure 13.
Dependence of single-channel conductance on extracellular Ca2+. The dataset in Fig. 11 is replotted here to better appreciate the quality of the fit of the current-voltage- aCao2+ data with Eqs. 2–4. The symbols correspond to the slopes of the individual I-V curves in Fig. 11, whereas the continuous lines are the computed values of Eq. 2 (divided by voltage) using the estimated parameters in Table II. For most data points, the error bars (standard errors estimated from linear fits to the individual I-Vs) are smaller than the symbols. The points corresponding to zero extracellular Ca2+ are, naturally, absent from this type of logarithmic display. Note that the [Ca2+]o is given in terms of both activity (bottom axes) and concentration (top axes), although only aCao2+ values were used for the fits in Fig. 11.
Figure 14.
Figure 14.
Dependence of fractional Ca2+ currents on extracellular Ca2+. Eq. 5 was computed for the different constructs using the estimated parameters in Table II. The vertical dashed line indicates the physiological value of [Ca2+]o = 1.8 mM. For clarity, the data corresponding to two of the AChR mutants (εL221 and εL269F) are omitted from this plot.
Figure 15.
Figure 15.
I-V curves recorded in the outside-out configuration in the presence and absence of Ca2+ on the extracellular side. I-V curves from the εT264P mutant were recorded with (in mM) 150 NaCl, 1.7 MgCl2, and 10 HEPES/KOH, pH 7.4, bathing both sides of the channel. Red symbols correspond to the curve recorded in the additional presence of 100 mM (concentration) Ca2+ on the extracellular side (data from three patches). At this saturating concentration of Ca2+, the inward currents are almost exclusively carried by Ca2+. Black symbols correspond to the curve recorded in the absence of added Ca2+ (data from three patches). The projections of the straight lines fitted to the plots (dashed lines) intercept the voltage axis at zero (no Ca2+ added) and +18 mV ([Ca2+]o = 100 mM), as expected from a nonselective cation channel with measurable permeability to Ca2+. The value of the reversal potential at [Ca2+]o = 100 mM, however, may well be more depolarized than the indicated intercept. The slopes are (69.8 ± 0.8) pS at [Ca2+]o = 0 and (30.6 ± 0.6) pS at [Ca2+]o = 100 mM. The displacement along the voltage axis of the Ca2+-carried component of the total current at the physiological value of [Ca2+]o = 1.8 mM (and in the presence of Na+ and Mg2+) is expected to be much smaller than that at [Ca2+]o = 100 mM. In these outside-out experiments, the reference Ag/AgCl wire was connected to the bath solution through an agar bridge containing 200 mM KCl. Liquid-junction potentials were corrected as described previously (Barry and Lynch, 1991; Barry, 1994).

Comment in

References

    1. Ascher P., Nowak L. 1988. The role of divalent cations in the N-methyl-d-aspartate responses of mouse central neurones in culture.J. Physiol. 399:247–266 - PMC - PubMed
    1. Auerbach A., Akk G. 1998. Desensitization of mouse nicotinic acetylcholine receptor channels. A two-gate mechanism.J. Gen. Physiol. 112:181–197 - PMC - PubMed
    1. Barbour B., Häusser M. 1997. Intersynaptic diffusion of neurotransmitter.Trends Neurosci. 20:377–384 - PubMed
    1. Barry P.H. 1994. JPCalc, a software package for calculating liquid junction potential corrections in patch-clamp, intracellular, epithelial and bilayer measurements and for correcting junction potential measurements.J. Neurosci. Methods. 51:107–116 - PubMed
    1. Barry P.H., Lynch J.W. 1991. Liquid junction potentials and small cell effects in patch-clamp analysis.J. Membr. Biol. 121:101–117 - PubMed

Publication types

MeSH terms