. 2009 Apr 30;113(18):4331-40.
doi: 10.1182/blood-2008-09-178350. Epub 2009 Jan 26.

Inhibition of aurora kinases for tailored risk-adapted treatment of multiple myeloma

Affiliations

Inhibition of aurora kinases for tailored risk-adapted treatment of multiple myeloma

Dirk Hose et al. Blood. .

Abstract

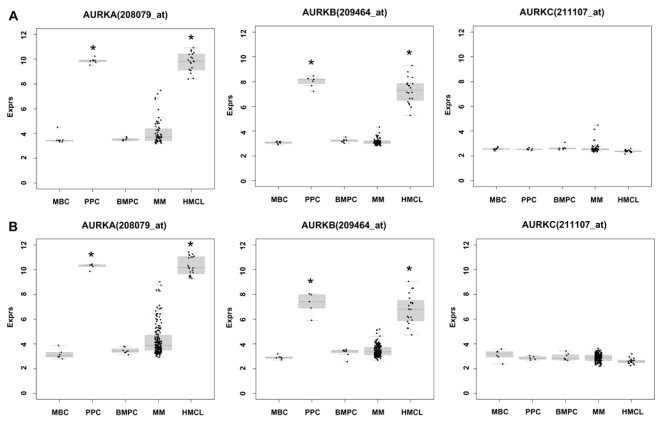
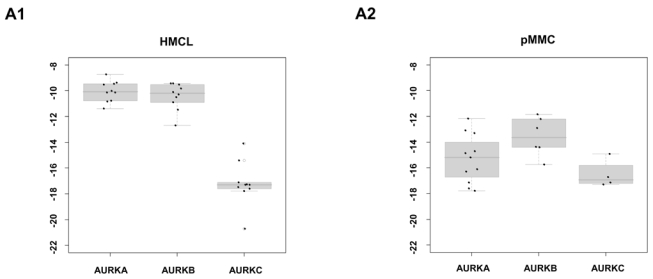
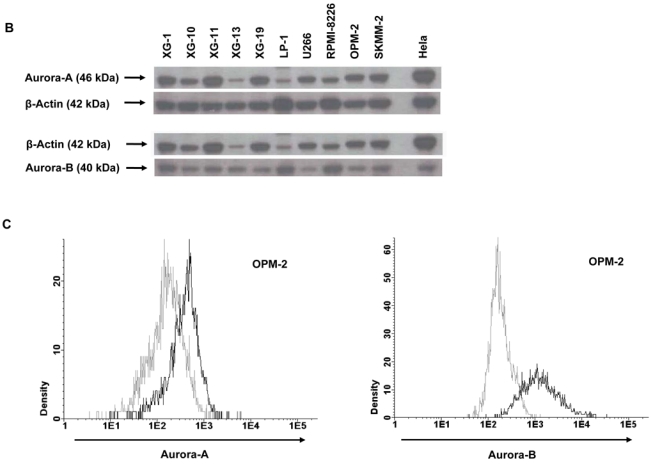
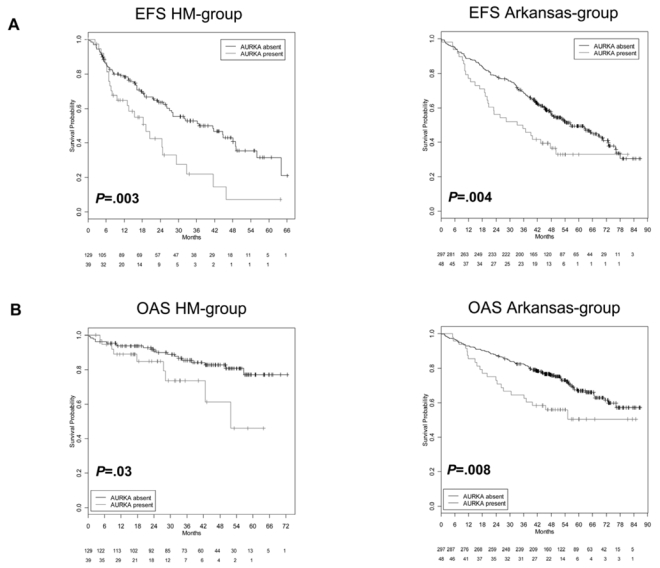
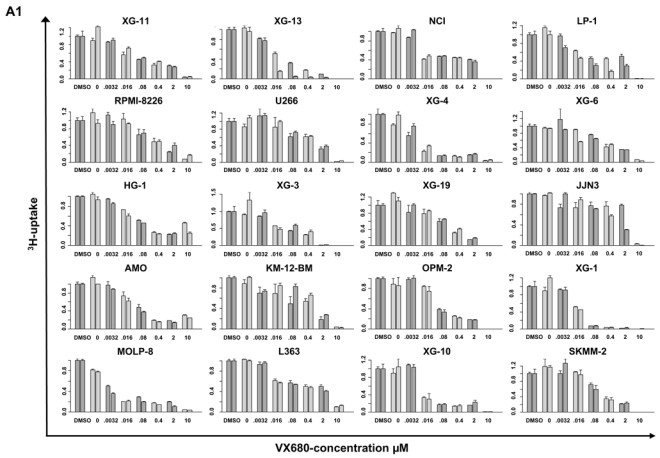
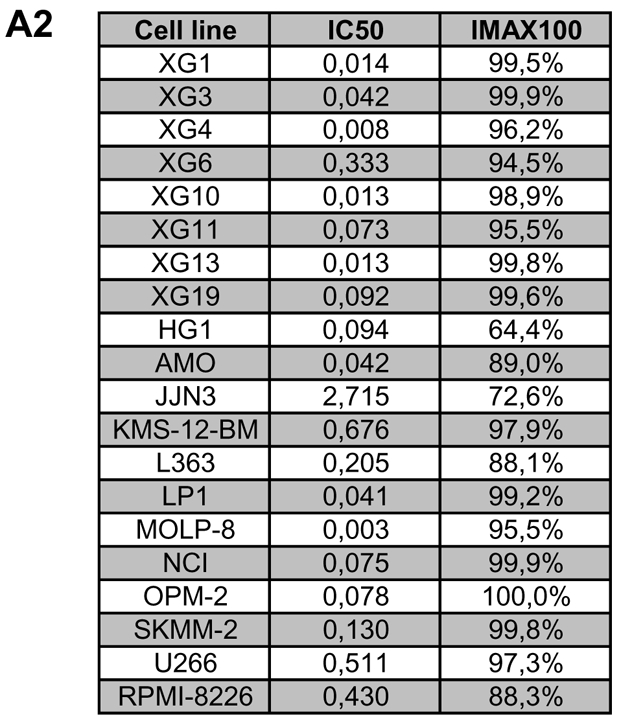
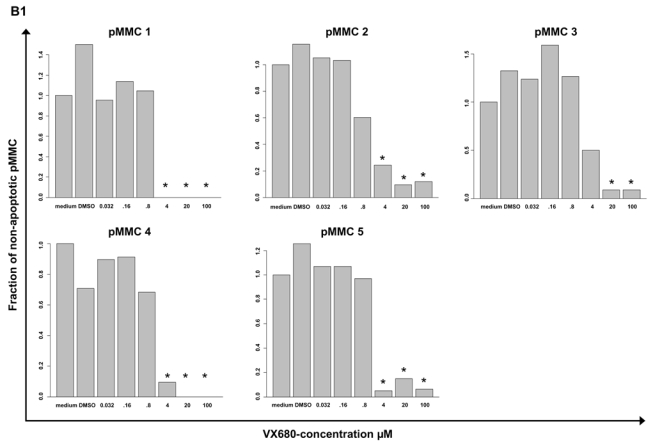
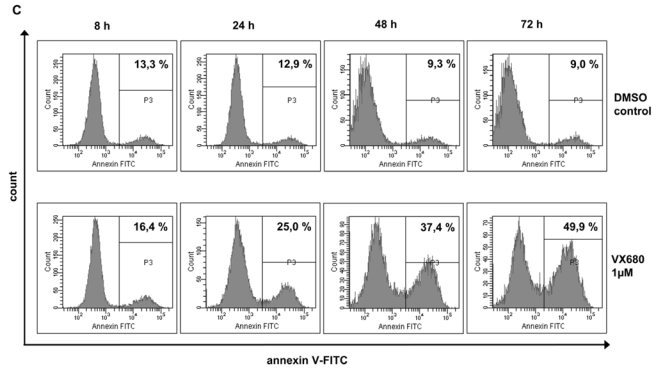
Genetic instability and cellular proliferation have been associated with aurora kinase expression in several cancer entities, including multiple myeloma. Therefore, the expression of aurora-A, -B, and -C was determined by Affymetrix DNA microarrays in 784 samples including 2 independent sets of 233 and 345 CD138-purified myeloma cells from previously untreated patients. Chromosomal aberrations were assessed by comprehensive interphase fluorescence in situ hybridization and proliferation of primary myeloma cells by propidium iodine staining. We found aurora-A and -B to be expressed at varying frequencies in primary myeloma cells of different patient cohorts, but aurora-C in testis cell samples only. Myeloma cell samples with detectable versus absent aurora-A expression show a significantly higher proliferation rate, but neither a higher absolute number of chromosomal aberrations (aneuploidy), nor of subclonal aberrations (chromosomal instability). The clinical aurora kinase inhibitor VX680 induced apoptosis in 20 of 20 myeloma cell lines and 5 of 5 primary myeloma cell samples. Presence of aurora-A expression delineates significantly inferior event-free and overall survival in 2 independent cohorts of patients undergoing high-dose chemotherapy, independent from conventional prognostic factors. Using gene expression profiling, aurora kinase inhibitors as a promising therapeutic option in myeloma can be tailoredly given to patients expressing aurora-A, who in turn have an adverse prognosis.


Conflict of interest statement

Conflict-of-interest disclosure: The authors declare no competing financial interests.

Figures

Figure 1
Figure 1. Expression of Aurora-A (AURKA), -B (AURKB), and -C (AURKC) as determined by gene expression profiling
in memory B-cells (MBC), polyclonal plasmablastic cells (PPC), normal plasma cells (BMPC), myeloma cells (MMC), and myeloma cell lines (HMCL) within the (A) training and (B) validation group. An asterisk (*) indicates a significant difference of the indexed population compared to both, BMPC and MBC at a level of P<.001.
Figure 2
Figure 2. Validation of gene expression by quantitative real-time PCR, western blotting and flow cytometry
To validate gene expression data, quantitative real-time PCR for Aurora-A, -B, -C in (A1) 10 myeloma cell lines (HMCL) and (A2) 10 primary myeloma cells (pMMC) was performed. Shown are -dCt-values (reference gene 18S-RNA). (B) Gene expression data were further validated by western blotting. Shown are the blots of 10 cell lines for Aurora-A and -B with β-actin as loading control and HELA cells as positive control, respectively. (C) Intracytoplasmatic expression of Aurora-A and -B as determined by flow cytometry. Shown is the cell line OPM-2. Light grey line: control without primary antibody, black line: measurement with primary and secondary antibody.
Figure 3
Figure 3. Prognostic relevance of Aurora-A expression for two independent groups of patients treated with high-dose therapy and autologous stem cell transplantation
Shown are (A) event-free (EFS) and (B) overall survival (OAS) in our cohort of patients (left side) and the Arkansas-group (right side) for absence (black curve) vs. presence (grey curve) of Aurora-A expression in CD138-purified myeloma cells. Presence of Aurora-A expression in myeloma cells is an adverse prognostic factor in terms of EFS and OAS in both groups.
Figure 4
Figure 4. Inhibition of proliferation of myeloma cell lines as well as survival of primary myeloma cells and cells of the bone marrow microenvironment
(A1) Inhibition of proliferation of 20 myeloma cell lines by the pan-Aurora-kinase inhibitor VX680 in graded concentrations vs. medium- and DMSO-control, respectively, measured by 3H-thymidine uptake. Two independent experiments were performed in triplicates. (A2) The IC50 (in μM) and maximal inhibition at 10 μM (IMAX10 in %) are shown. (B1) Survival of primary myeloma cells (pMMC) cultured within their bone marrow microenvironment (negative fraction of plasma cell purification) is significantly inhibited compared to the medium control as determined by staining with anti-CD138-FITC antibody and propidium iodine. An asterisk (*) indicates a significant decrease between the medium control and the respective VX680 concentration. (B2) Survival of cells within the bone marrow microenvironment (BMME cells; negative fraction of plasma cell purification) was determined as described above for pMMC. An asterisk (*) indicates a significant decrease between the medium control and the respective VX680 concentration. (C) Induction of apoptosis by VX680 at 1 μM as determined by annexin V-staining after 8, 24, 48 and 72 h.

Similar articles

Cited by

References

    1. Kyle RA, Rajkumar SV. Multiple myeloma. N Engl J Med. 2004;351:1860–1873. - PubMed
    1. Witzig TE, Timm M, Larson D, Therneau T, Greipp PR. Measurement of apoptosis and proliferation of bone marrow plasma cells in patients with plasma cell proliferative disorders. Br J Haematol. 1999;104:131–137. - PubMed
    1. Boccadoro M, Gavarotti P, Fossati G, et al. Low plasma cell 3(H) thymidine incorporation in monoclonal gammopathy of undetermined significance (MGUS), smouldering myeloma and remission phase myeloma: a reliable indicator of patients not requiring therapy. Br J Haematol. 1984;58:689–696. - PubMed
    1. Greipp PR, Lust JA, O’Fallon WM, et al. Plasma cell labeling index and beta 2-microglobulin predict survival independent of thymidine kinase and C-reactive protein in multiple myeloma. Blood. 1993;81:3382–3387. - PubMed
    1. Cremer FW, Bila J, Buck I, et al. Delineation of distinct subgroups of multiple myeloma and a model for clonal evolution based on interphase cytogenetics. Genes Chromosomes Cancer. 2005;44:194–203. - PubMed

Publication types

MeSH terms