. 2009 Feb 10;106(6):1720-4.
doi: 10.1073/pnas.0806746106. Epub 2009 Jan 26.

Model of genetic variation in human social networks

Affiliations

Model of genetic variation in human social networks

James H Fowler et al. Proc Natl Acad Sci U S A. .

Abstract

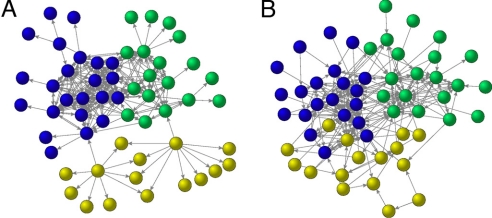
Social networks exhibit strikingly systematic patterns across a wide range of human contexts. Although genetic variation accounts for a significant portion of the variation in many complex social behaviors, the heritability of egocentric social network attributes is unknown. Here, we show that 3 of these attributes (in-degree, transitivity, and centrality) are heritable. We then develop a "mirror network" method to test extant network models and show that none account for observed genetic variation in human social networks. We propose an alternative "Attract and Introduce" model with two simple forms of heterogeneity that generates significant heritability and other important network features. We show that the model is well suited to real social networks in humans. These results suggest that natural selection may have played a role in the evolution of social networks. They also suggest that modeling intrinsic variation in network attributes may be important for understanding the way genes affect human behaviors and the way these behaviors spread from person to person.


Conflict of interest statement

The authors declare no conflict of interest.

Figures

Fig. 1.
Fig. 1.
Heritability of network characteristics in a real social network (Add Health) and simulated networks based on 5 models, the Attract and Introduce model; a social space model (8); a “fitness” model (7); an exponential random graph model (ERGM) (12); and an Erdos–Renyi random network (27). We used additive genetic models of monozygotic and dizygotic twins in Add Health to measure the heritability of network characteristics in real human social networks (see SI). The blue bars show that genetic variation accounts for significant variation in in-degree, transitivity, and betweenness centrality (vertical lines indicate 95% confidence intervals, asterisks indicate which confidence intervals exclude 0). These results suggest intrinsic characteristics have an important impact on the fundamental building blocks of real human social networks. Heritability of out-degree is not significant. To see which network models are capable of generating heritability consistent with the empirical observations, we simulated 10,000 pairs of networks and used the “mirror network” method for each proposed model to measure how much variance in network measures can be explained by intrinsic node characteristics. Compared with heritability estimates from the real social network data, all proposed models are rejected because they fall outside the confidence intervals except ERGM for in-degree and transivity, and Attract and Introduce for all three significantly heritable network properties (in-degree, transitivity, and centrality).
Fig. 2.
Fig. 2.
Comparison of degree distributions in real social networks (within each of the 146 schools in the Add Health sample) and like-sized simulated networks based on 5 models, the Attract and Introduce model; a social space model (8); a fitness model (7); an ERGM (12); and an Erdos–Renyi random network (27). In Upper Left, each line indicates the in-degree distribution for each school in Add Health. In other images, line indicates the degree distribution in one simulation that assumes the same number of nodes and edges as each of the 146 schools. The color of each line indicates the size of the network (number of nodes) with yellow shades for small, green for medium, and blue for large networks (total range 9 to 2,724, mean 752). The fitness model generates a power-law tail in the degree distribution that is overdispersed (more nodes with higher degree, fewer nodes with lower degree) compared with the real data, whereas the Erdos–Renyi and social space models generate an exponential cutoff and a degree distribution that is underdispersed. Both ERGM and the Attract and Introduce model are slightly overdispersed, but ERGM in particular shows greater dispersion for larger networks (blue lines are lower for low degree and higher for high degree) in a pattern that does not exist in the real data (the social space model also exhibits an unrealistically strong relationship between network size and dispersion). The Attract and Introduce model produces variation in degree distributions across networks that is similar to Add Health.
Fig. 3.
Fig. 3.
Comparison of node degree and mean node transitivity in a real social network (Add Health) and simulated networks based on 5 models, the Attract and Introduce model; a social space model (8); a fitness model (7); an ERGM (12); and an Erdos–Renyi random network (27). We used the number of nodes and edges for each observed network in Add Health to generate 1,000 simulated networks for each proposed model and then calculated the mean node transitivity for all nodes of a given degree. The Attract and Introduce model deviates least from the observed data.
Fig. 4.
Fig. 4.
Comparison of community structure in real and simulated networks. (A) School 115 (57 nodes and 252 ties) from the Add Health data. (B) Simulated network, using the Attract and Introduce model and the same number of nodes and ties. These networks show significant modularity with well-defined communities that have many connections within their group and few connections to other groups. Colors indicate communities that maximize modularity (11) (modularity = 0.35 in real network; modularity = 0.34 in simulated network).
Fig. 5.
Fig. 5.
The Attract and Introduce model best fits the motif structure of observed networks. (A) We simulate 100 networks from each proposed model, using the empirical distribution of nodes and edges in each Add Health network. We then count the total number of 3-motifs (isomorphic combinations of ties that connect 3 nodes) in each network and divide by the total number of motifs in that network to generate the empirical probability that 3 nodes form any given motif (the 3-motif fingerprint of the network) (–50). For each motif, we fit 1 dimension of a multivariate beta density across all simulated networks to characterize the empirical probability of observing a given motif for a given model. We then use this estimated density to calculate the likelihood that the observed network could have been generated from the proposed model. For ease of exposition, we show adjusted likelihoods −log(cLL), where c is a constant across all networks and models and LL is the log likelihood of generating an observed network. Each point in the figure represents the adjusted likelihood that a proposed model generates an observed Add Health network of a given size. Among all proposed models, Attract and Introduce (green circles) is the most likely to generate the 3-motif fingerprint in all of the Add Health networks, as shown. (B) We repeat the fingerprint procedure for 4-motifs (isomorphic combinations of ties that connect 4 nodes). Attract and Introduce is also the most likely to generate the 4-motif fingerprint in 98 of 100 Add Health networks. Exponential random graph models (violet diamonds) are most likely to generate the 4-motif fingerprint for 2 of 100 Add Health networks. For comparison, we also show adjusted likelihoods generated using a multivariate beta density fit to the actual data (blue dashes). In the SI we show that simulated networks are classified correctly in 10,000 of 10,000 tests, using the fingerprint procedure.

Comment in

References

    1. Barabasi A-L, Albert R. Emergence of scaling in random networks. Science. 1999;286:509–512. - PubMed
    1. Jackson MO, Wolinsky A. A strategic model of economic and social networks. J Econ Theory. 1996;71:44–74.
    1. Bala V, Goyal S. A non-cooperative model of network formation. Econometrica. 2000;68:1181–1231.
    1. Cartwright D, Harary F. Structural balance: A generalization of Heider's theory. Psychol Rev. 1956;63:277–292. - PubMed
    1. McPherson M, Smith-Lovin L, Cook JM. Birds of a feather: Homophily in social networks. Annual Rev Sociol. 2001;27:415–444.

Publication types

LinkOut - more resources