. 2009 Apr 24;284(17):11374-84.
doi: 10.1074/jbc.M807868200. Epub 2009 Jan 26.

Structure and function of an NADPH-cytochrome P450 oxidoreductase in an open conformation capable of reducing cytochrome P450

Affiliations

Structure and function of an NADPH-cytochrome P450 oxidoreductase in an open conformation capable of reducing cytochrome P450

Djemel Hamdane et al. J Biol Chem. .

Abstract

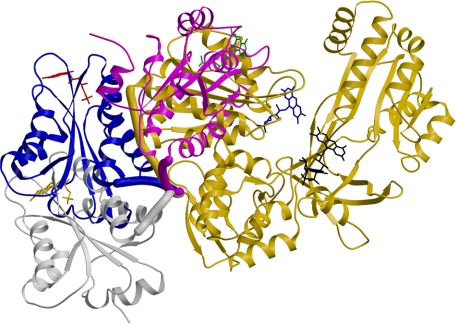
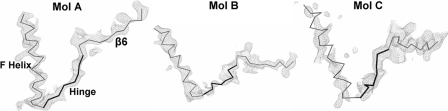
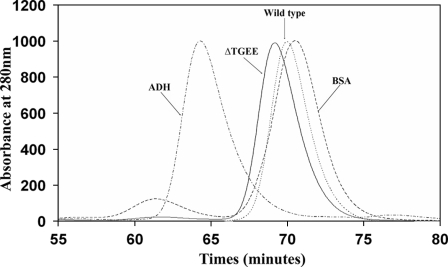
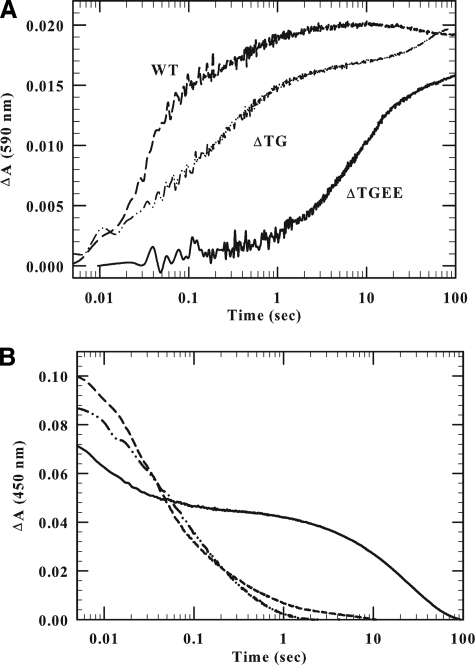
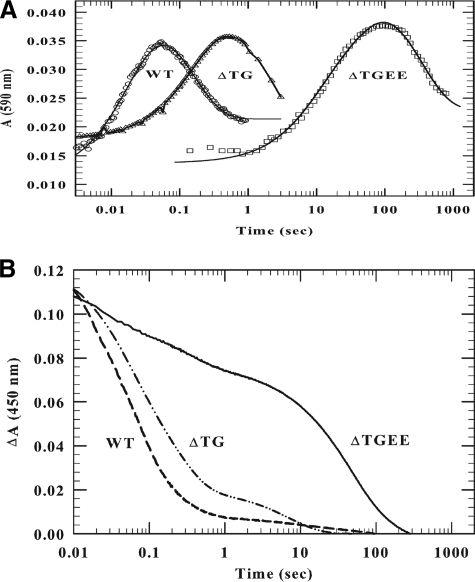
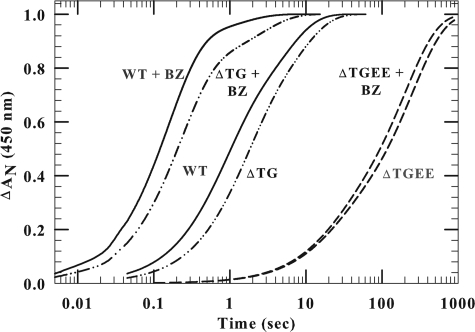
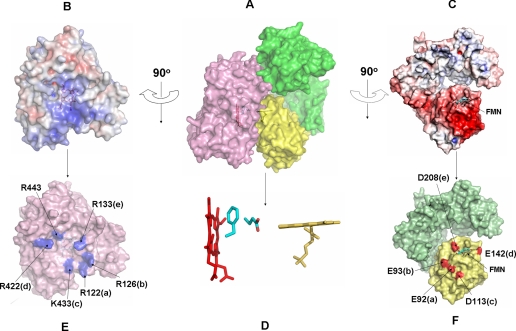
NADPH-cytochrome P450 oxidoreductase (CYPOR) catalyzes the transfer of electrons to all known microsomal cytochromes P450. A CYPOR variant, with a 4-amino acid deletion in the hinge connecting the FMN domain to the rest of the protein, has been crystallized in three remarkably extended conformations. The variant donates an electron to cytochrome P450 at the same rate as the wild-type, when provided with sufficient electrons. Nevertheless, it is defective in its ability to transfer electrons intramolecularly from FAD to FMN. The three extended CYPOR structures demonstrate that, by pivoting on the C terminus of the hinge, the FMN domain of the enzyme undergoes a structural rearrangement that separates it from FAD and exposes the FMN, allowing it to interact with its redox partners. A similar movement most likely occurs in the wild-type enzyme in the course of transferring electrons from FAD to its physiological partner, cytochrome P450. A model of the complex between an open conformation of CYPOR and cytochrome P450 is presented that satisfies mutagenesis constraints. Neither lengthening the linker nor mutating its sequence influenced the activity of CYPOR. It is likely that the analogous linker in other members of the diflavin family functions in a similar manner.


Figures

FIGURE 1.
FIGURE 1.
Crystal structure of three conformations of ΔTGEE. Three conformations of ΔTGEE and the wild-type structure are compared. The relative orientations of FMN domains of Mol A (magenta; FMN is green), Mol B (blue; FMN is red), and Mol C (gray; FMN is yellow) of ΔTGEE, when their FAD domains are superimposed onto the wild-type CYPOR structure (gold; FMN is blue, and FAD is black). For clarity, only the FAD domain of wild-type is shown. The hinges are depicted as thick tubes in their respective colors, and the flavins are shown as stick models. The FMN domain moves away from the FAD domain by extending the hinge and simultaneously rotating about a pivot point, which is located on the backbone carbonyl of the C-terminal residue of the hinge (Arg-243 in wild-type numbering). Note that the FMN isoalloxazine ring is exposed to solvent in all three conformations such that its dimethyl group can interact with cyt P450.
FIGURE 2.
FIGURE 2.
Omit |Fo| - |Fc| map of the ΔTGEE hinge regions for all three molecules, Mol A, Mol B, and Mol C. The last helix (helix F) of the FMN domain and the first β strand (β6) of the connecting/FAD domain are depicted with thin lines, and the hinge sections are depicted with thick lines. Maps are contoured at the 2.5 σ level. Although side chains of some residues in the hinge regions are not visible, the main chains of all three hinges are clearly defined.
FIGURE 3.
FIGURE 3.
Quaternary structure of the ΔTGEE protein. HPLC gel filtration profiles of wild-type (dotted curve) and ΔTGEE (solid curve). For column calibration, bovine serum albumin (BSA, 66kDa) and alcohol dehydrogenase (ADH, 150 kDa) were used. The mutant protein eluted slightly faster than the wild type, indicating that the mutant is monomeric, but slightly more elongated than wild type.
FIGURE 4.
FIGURE 4.
Kinetics of reduction of wild-type, ΔTG, and ΔTGEE CYPOR by 1 molar equivalent of NADPH. The final concentration after mixing the CYPOR- and NADPH-containing solutions in the anaerobic stopped-flow spectrophotometer was 10 μm for the wild-type and ΔTG protein and 8.5 μm for ΔTGEE. The kinetic traces have been normalized. A, the absorbance increase at 590 nm indicates blue semiquinone formation; B, the decrease in absorbance at 450 nm reflects flavin reduction. The experiments were conducted at 25 °C, as described under “Experimental Procedures.”
FIGURE 5.
FIGURE 5.
Kinetics of reduction of wild-type, ΔTG, and ΔTGEE CYPOR by 10 molar equivalents of NADPH. The experiment was performed at 25 °C as described in the legend to Fig. 4 and under “Experimental Procedures.” The final reductase concentrations were 15 μm (590 nm) and 10 μm (450 nm). NADPH concentrations were 150 μm and 100 μm to provide a 10-fold molar excess. The absorbance was followed at 590 nm to observe blue semiquinone formation (A) and at 450 nm to estimate flavin reduction (B).
FIGURE 6.
FIGURE 6.
Kinetics of reduction of ferric cytochrome P450 by wild-type and mutant CYPOR in the presence of CO. The ΔAN (normalized absorbance) represents the ratio between 450 nm A - At and 450 nm A - At = 0, where t = time and ∞ is infinity. The final cyt P450 and reductase concentration after mixing with NADPH was 5 μm. Final NADPH concentration was 50 μm. Experiments were conducted as described under “Experimental Procedures” with a saturated solution of CO in both syringes. BZ, benzphetamine.
FIGURE 7.
FIGURE 7.
Model of a complex between cyt P450 2B4 and Mol A of ΔTGEE. A, surface representation of the model complex: pink, cyt P450; yellow, FMN domain; and green, FAD domain. B and C, electrostatic surface of the interfaces of cyt P450 (B) and CYPOR (C) where blue represents a positively charged surface and red is a negative surface. The heme and flavin are shown below the surface of cyt P450 and CYPOR, respectively. D, stick representation of heme (red) and FMN (yellow) cofactors in the complex showing their relative orientations and the two residues (Phe-429 and Glu-549) of cyt P450 that lie in between the two redox cofactors. E and F, interfaces of docked CYPOR and cyt P450. Five pairs of salt bridges are shown at the interface between cyt P450 and CYPOR. The salt-bridge pairs are marked with the same letters, i.e. R122(a) of cyt P450 pairs with E92(a) of CYPOR. Arg-443 of cyt P450 forms an H-bond with Tyr-178 of the CYPOR. The views are the same as those in panels B and C, respectively.

Similar articles

Cited by

References

    1. Masters, B. S., and Okita, R. T. (1980) Pharmacol. Ther. 9 227-244 - PubMed
    1. Paine, M. J., Scrutton, N. S., Munro, A. W., Gutierrez, A., Robert, G. C. K., and Wolf, C. R. (2005) in Cytochrome P450, 3rd Ed. (Ortiz de Montellano, P. R., ed) pp. 115-148, Kluwer Academic/Plenum Publishers, New York
    1. Schacter, B. A., Nelson, E. B., Marver, H. S., and Masters, B. S. (1972) J. Biol. Chem. 247 3601-3607 - PubMed
    1. Enoch, H. G., and Strittmatter, P. (1979) J. Biol. Chem. 254 8976-8981 - PubMed
    1. Horecker, B. L. (1950) J. Biol. Chem. 183 593-605

Publication types

Associated data