. 2009 Sep;58(9):1363-73.
doi: 10.1007/s00262-008-0646-7. Epub 2009 Jan 27.

Metastatic tumour cells favour the generation of a tolerogenic milieu in tumour draining lymph node in patients with early cervical cancer

Affiliations

Metastatic tumour cells favour the generation of a tolerogenic milieu in tumour draining lymph node in patients with early cervical cancer

Alessandra Battaglia et al. Cancer Immunol Immunother. 2009 Sep.

Abstract

Objective: We compared the immune system state in metastatic tumour draining lymph nodes (mTDLN) and metastasis free TDLN (mfTDLN) in 53 early stage cervical cancer patients to assess whether the presence of metastatic tumour cells worsen the balance between an efficacious anti-tumour and a tolerogenic microenvironment.

Methods: The immune system state was measured by immunophenotypic and functional assessment of suppressor and effector immune cell subsets.

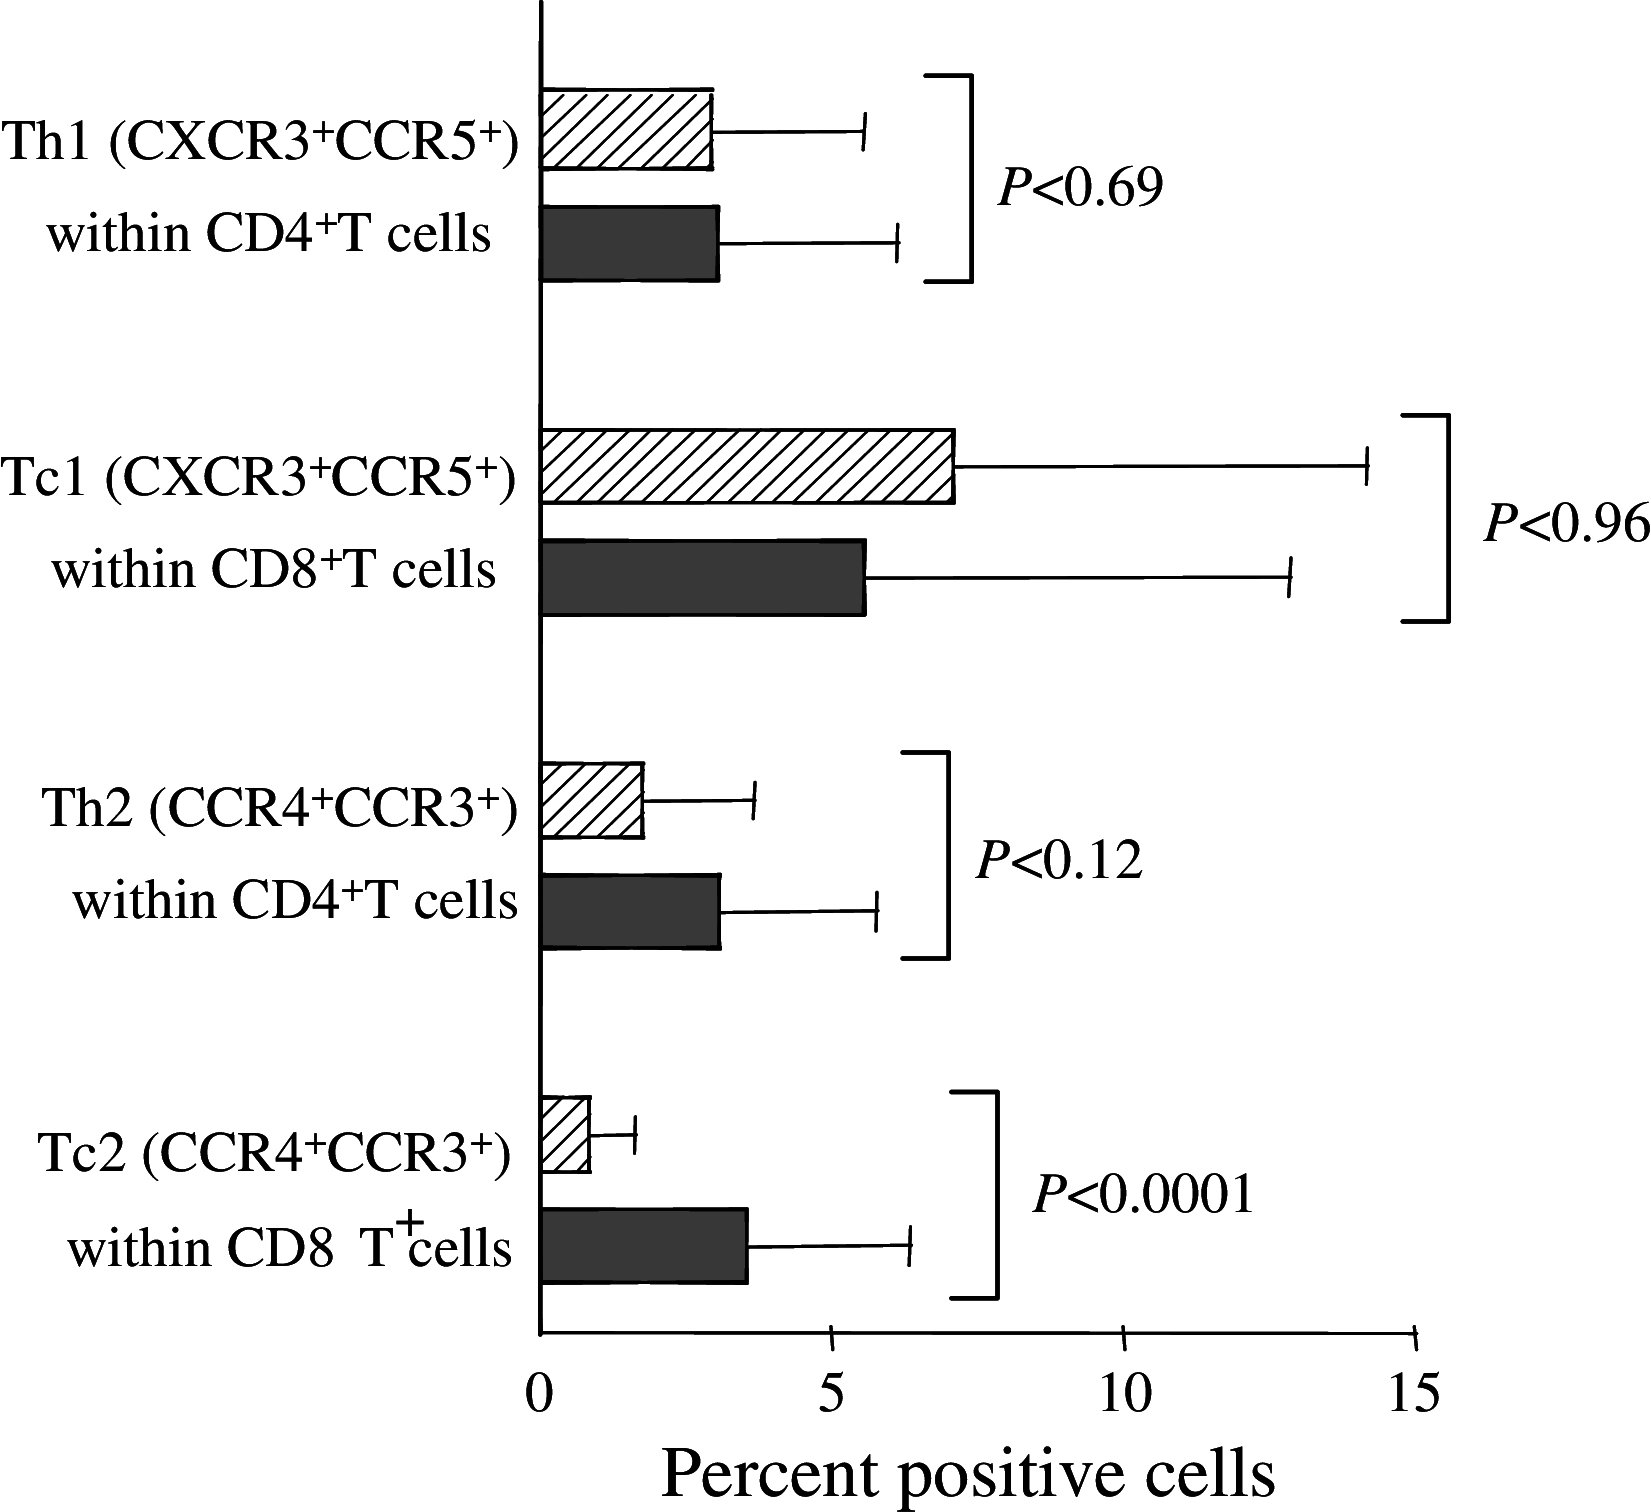
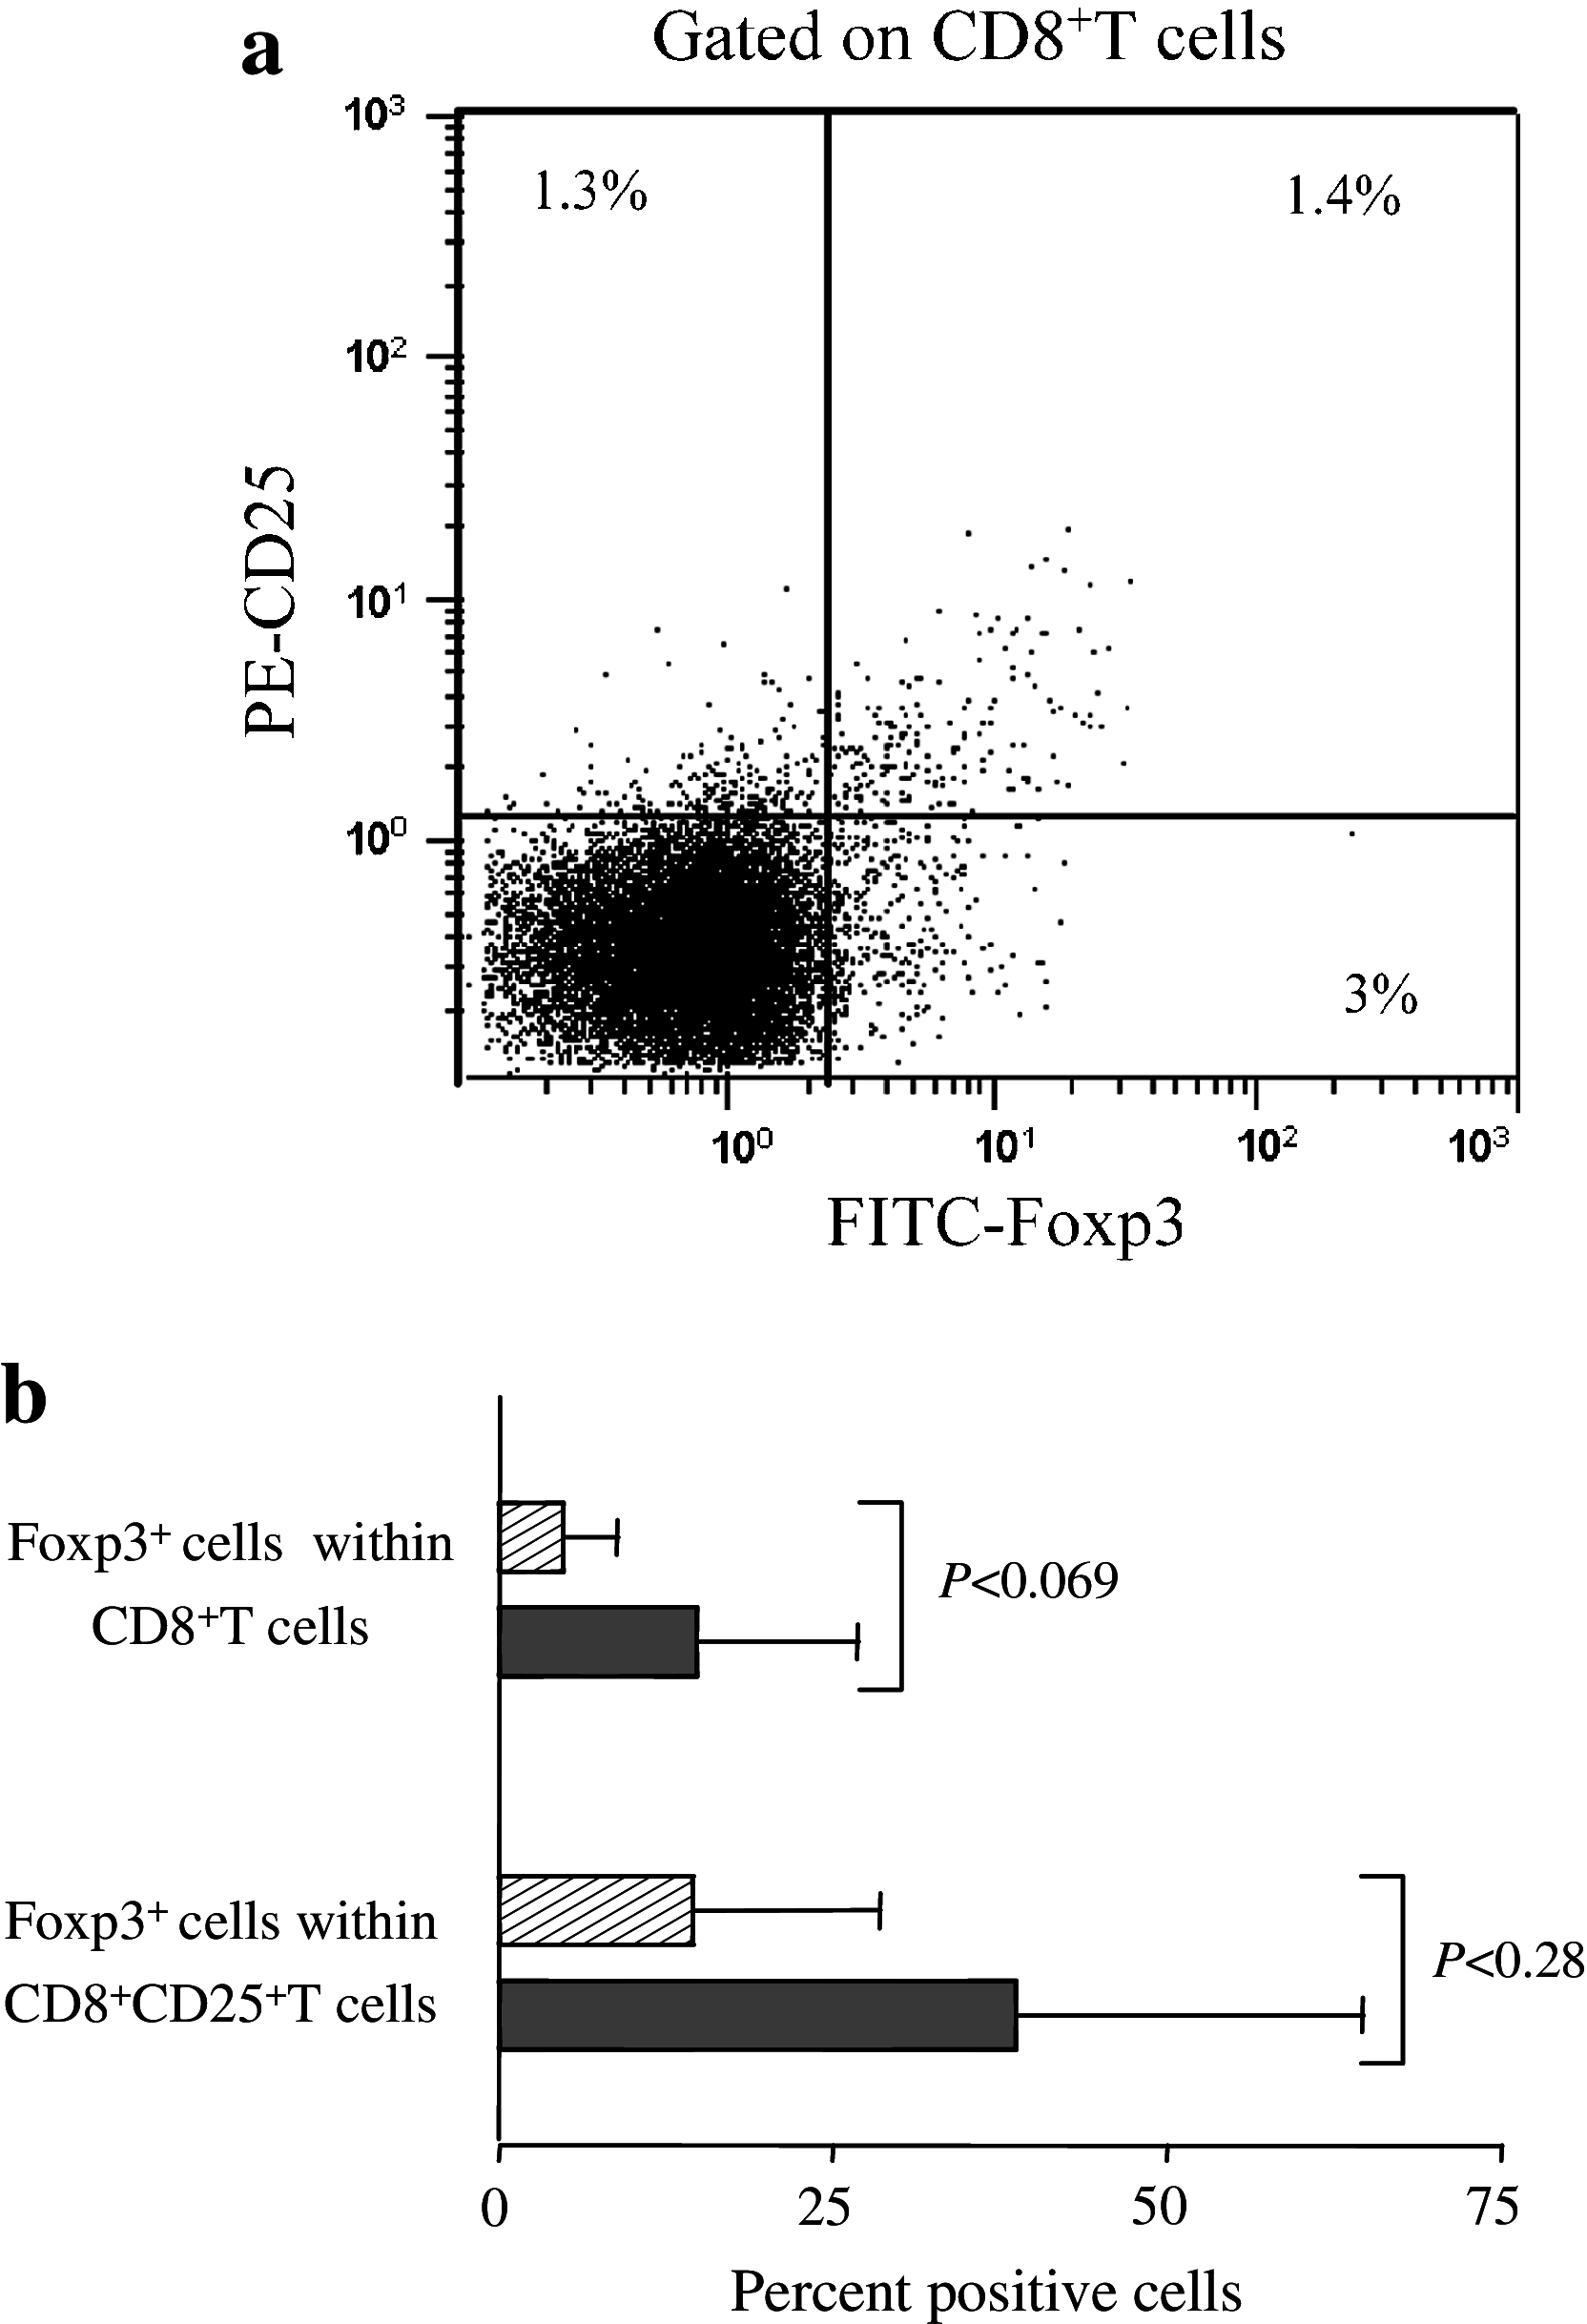
Results: Compared to mfTDLN, mTDLN were significantly enriched in CD4(+)Foxp3(+) regulatory T cells (Treg), which, in addition, exhibited an activated phenotype (HLA-DR(+) and CD69(+)). Treg in mTDLN were also significantly enriched in neuropilin-1 (Nrp1) expressing cells, a subset particularly potent in dampening T cell responses. mTDLN tended to be enriched in a population of CD8(+)Foxp3(+)T cells (operationally defined as CD8(+)Treg) that showed a suppressor potency similar to Treg under the same experimental conditions. Plasmacytoid dendritic cells (pDC) and myeloid DC (mDC) generally show distinct roles in inducing T cell tolerance and activation, respectively. In line with the excess of suppressor T cells, the ratio pDC to mDC was significantly increased in mTDLN. Immunohistochemical testing showed that metastatic tumour cells produced the vascular endothelial growth factor, a natural ligand for Nrp1 expressed on the cell surface of Nrp1(+)Treg and pDC, and therefore a potential mediator by which tumour cells foster immune privilege in mTDLN. Consistent with the overall tolerogenic profile, mTDLN showed a significant Tc2 polarisation and tended to contain lower numbers of CD45RA(+)CD27(-) effector memory CD8(+)T cells.

Conclusions: The increased recruitment of suppressor type cells concomitant with the scarcity of cytotoxic type cells suggests that in mTDLN the presence of tumour cells could tip the balance against anti-tumour immune response facilitating the survival of metastatic tumour cells and possibly contributing to systemic tolerance.


Figures

Fig. 1
Fig. 1
Treg assessment in mfTDLN and mTDLN. a Cells of a representative mTDLN were mechanically dissociated and analysed by flow cytometry to assess CD25 and Foxp3 expression modality on CD4+T cells. Numbers in quadrants indicate the percentage of cells expressing the relevant marker. b Percentage of Foxp3+ cells within CD4+T cells and percentage of Foxp3+ cells within CD4+CD25+T cells. Histograms show mean values ± SD from analyses performed in 31 mfTDLN (hatched bars) and 7 mTDLN (filled bars). c Percentage of CD69+, HLA-DR+ and Nrp1+ cells within CD4+Foxp3+T cells and d within CD4+Foxp3T cells. Histograms show mean values ± SD from analyses performed in 28 mfTDLN (hatched bars) and 6 mTDLN (filled bars)
Fig. 2
Fig. 2
Type 1 and type 2 polarisation in mfTDLN and mTDLN. Th1 and Tc1 cells were assessed by staining T cells with CXCR3, CCR5 and either CD4 (Th1) or CD8 (Tc1). Th2 and Tc2 cells were assessed by staining T cells with CCR4, CCR3 and either CD4 (Th2) or CD8 (Tc2). Percentages of cells positive for the various markers within CD4+ and CD8+ T cells in mfTDLN (hatched bars) or mTDLN (filled bars). Histograms show mean values ± SD from analyses performed in 35 mfTDLN and 7 mTDLN
Fig. 3
Fig. 3
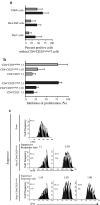
Suppression of T cell proliferation by CD4+CD25int/high T cells in mfTDLN and mTDLN, and superior suppressive activity of Nrp1+CD4+CD25int/high T cells in mTDLN. a Percentage of CD69, HLA-DR and Nrp1 expressing cells within immunomagnetically purified CD4+CD25int/highT cells. Histograms show mean values ± SD from analyses performed in 3 mfTDLN (hatched bars) and 2 mTDLN (filled bars). b Immunomagnetically purified CD4+CD25int/highT cells and CD4+CD25T cells as a control were cultured with CFSE-loaded CD25-depleted allogenic responder PBMC (5 × 104/well). Suppressor activity was tested at the indicated suppressor:responder ratios. The proliferative response was assessed on day 5 by computing the proliferation index by ModFit™/Cell Proliferation Model™ software and suppressive activity expressed as percent inhibition. Histograms show mean values ± SD from experiments carried out in 3 mfTDLN (hatched bars) and 2 mTDLN (filled bars). c Nrp1+CD4+CD25int/highT cells and Nrp1CD4+CD25int/highT cells from mTDLN were immunomagnetically sorted from CD4+CD25int/highT cells and cultured with CFSE-loaded CD25-depleted allogenic responder PBMC (5 × 104/well) at the indicated suppressor:responder ratios. At day 5 of culture, proliferation index (PI) was computed by ModFit™/Cell Proliferation Model™ software. PI and percent inhibition in each culture condition are shown. Data of one of two experiments with similar results are shown
Fig. 4
Fig. 4
CD8+Foxp3+T cells assessment in mfTDLN and mTDLN. a Cells of a representative mTDLN were mechanically dissociated and analysed by flow cytometry to assess CD25 and Foxp3 expression modality on CD8+T cells. Numbers in quadrants indicate the percentage of cells expressing the relevant marker. b Percentage of Foxp3+ cells within CD8+T cells and percentage of Foxp3+ cells within CD8+CD25+T cells. Histograms show mean values ± SD from analyses performed in 26 mfTDLN (hatched bars) and 6 mTDLN (filled bars)
Fig. 5
Fig. 5
Suppression of T cell proliferation by CD8+Foxp3+T cells. A Immunomagnetically purified CD8+CD25+T cells and, as comparison, CD4+CD25int/highT cells were incubated with CFSE-loaded CD25-depleted allogenic responder PBMC (5 × 104/well). Controls included CD8+CD25 and CD4+CD25 T cells. Suppressor activity was tested at the indicated suppressor:responder ratios. The proliferative response was assessed on day 5 by computing the proliferation index by ModFit™/Cell Proliferation Model™ software and suppressive activity expressed as percent inhibition. Histograms show mean values ± SD from experiments carried out in 3 mfTDLN. B The antiproliferative capacity of CD8+CD25+T cells on allogenic CD4+ and CD8+ T cells was tested by culturing CFSE-loaded CD25-depleted allogenic responder PBMC (5 × 104/well) in the absence (a, b) or in the presence (c, d) of CD8+CD25+T cells at a suppressor:responder ratio of 1:1. At day 5 of culture, responder cells were stained with PE-CD8 mAb, CFSE fluorescence histograms obtained separately for CD4+, i.e., CD8, (a, c), and CD8+ (b and d) cells, and PI calculated by ModFit™/Cell Proliferation Model™ software. PI and percent inhibition in each culture condition are shown. Representative of one of two separate experiments carried out in mfTDLN
Fig. 6
Fig. 6
Immunostaining for VEGF and Nrp1 in mTDLN. Left panel metastatic tumour cells (T) showing accumulation of VEGF immunoreaction in the cytoplasm. VEGF was mostly expressed by tumour cells facing lymphoid tissue (Ly). Scattered stromal cells, likely belonging to the macrophage lineage [2], are also VEGF+ (arrows). Original magnification ×100. Right panel Nrp1+pDC (reddish in the online publication) are visible among VEGF+ tumour cells (brownish in the online publication). VEGF staining in right panel was intentionally maintained low by reducing incubation time and mAb concentration so as not to interfere with Nrp1 staining. Original magnification ×400

Similar articles

Cited by

References

    1. Baars PA, Ribeiro Do Couto LM, Leusen JH, Hooibrink B, Kuijpers TW, Lens SM, van Lier RA. Cytolytic mechanisms and expression of activation-regulating receptors on effector-type CD8+CD45RA+CD27− human T cells. J Immunol. 2001;165:1910–1917. - PubMed
    1. Barbera-Guillem E, Nyhus JK, Wolford CC, Friece CR, Sampsel JW. Vascular endothelial growth factor secretion by tumor-infiltrating macrophages essentially supports tumor angiogenesis, and IgG immune complexes potentiate the process. Cancer Res. 2002;62:7042–7049. - PubMed
    1. Battaglia A, Buzzonetti A, Monego G, Peri L, Ferrandina G, Fanfani F, Scambia G, Fattorossi A. Neuropilin-1 expression identifies a subset of regulatory T cells in human lymph nodes that is modulated by pre-operative chemoradiation therapy in cervical cancer. Immunology. 2008;123:129–138. doi: 10.1111/j.1365-2567.2007.02737.x. - DOI - PMC - PubMed
    1. Battaglia A, Ferrandina G, Buzzonetti A, Malinconico P, Legge F, Salutari V, Scambia G, Fattorossi A. Lymphocyte populations in human lymph nodes. Alterations in CD4+CD25+ T regulatory cell phenotype and T-cell receptor Vβ repertoire. Immunology. 2003;110:304–312. doi: 10.1046/j.1365-2567.2003.01742.x. - DOI - PMC - PubMed
    1. Boor PP, Ijzermans JN, van der Molen RG, Binda R, Mancham S, Metselaar HJ, Kusters JG, de Jong E, Drexhage HA, Kwekkeboom J. Immunomagnetic selection of functional dendritic cells from human lymph nodes. Immunol Lett. 2005;99:162–168. doi: 10.1016/j.imlet.2005.02.013. - DOI - PubMed

MeSH terms