. 2009;17(1):47-64.
doi: 10.1007/s10577-008-9005-y. Epub 2009 Jan 27.

Chromatin condensation in terminally differentiating mouse erythroblasts does not involve special architectural proteins but depends on histone deacetylation

Affiliations

Chromatin condensation in terminally differentiating mouse erythroblasts does not involve special architectural proteins but depends on histone deacetylation

Evgenya Y Popova et al. Chromosome Res. 2009.

Abstract

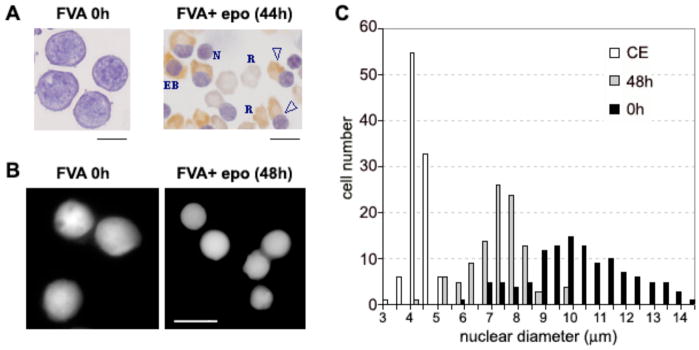
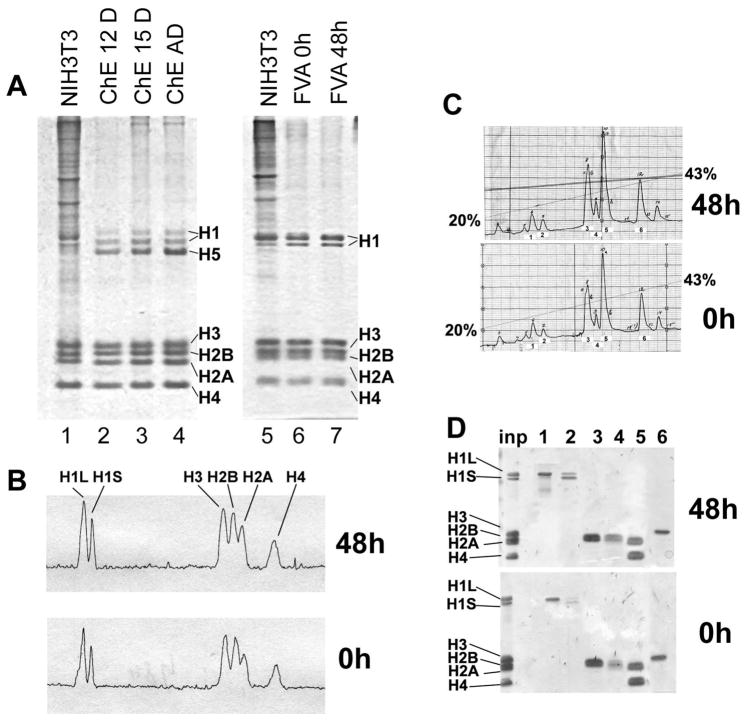
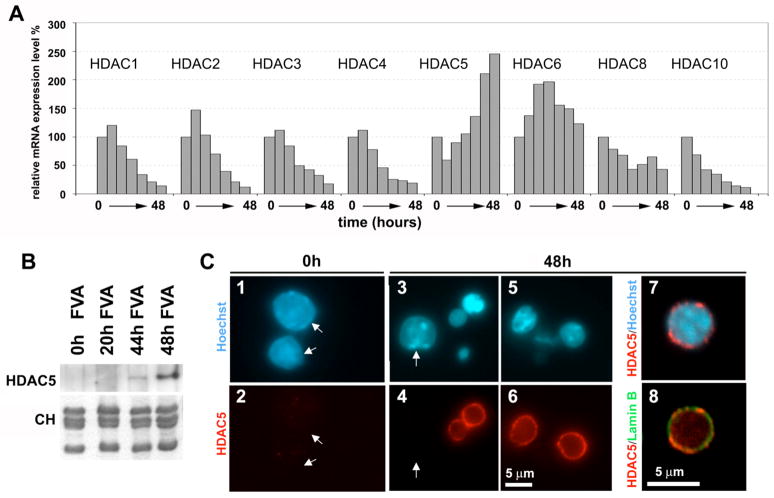
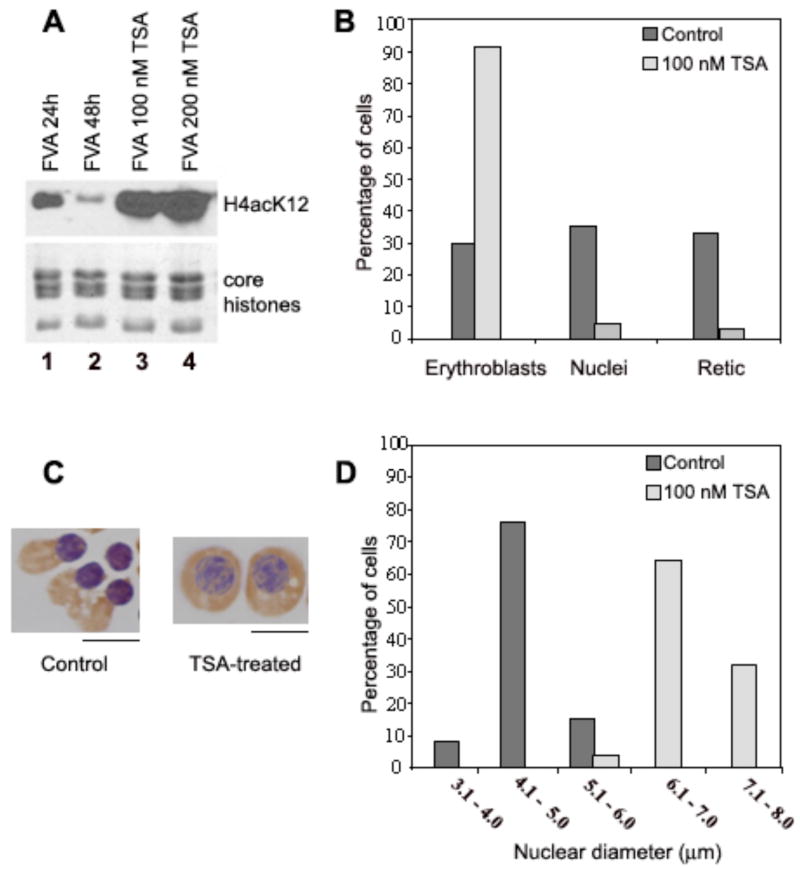
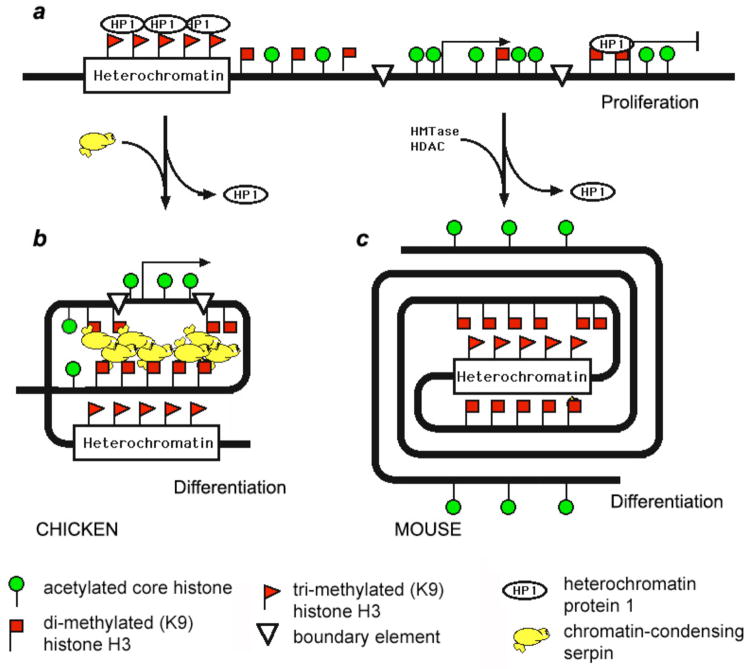
Terminal erythroid differentiation in vertebrates is characterized by progressive heterochromatin formation and chromatin condensation and, in mammals, culminates in nuclear extrusion. To date, although mechanisms regulating avian erythroid chromatin condensation have been identified, little is known regarding this process during mammalian erythropoiesis. To elucidate the molecular basis for mammalian erythroblast chromatin condensation, we used Friend virus-infected murine spleen erythroblasts that undergo terminal differentiation in vitro. Chromatin isolated from early and late-stage erythroblasts had similar levels of linker and core histones, only a slight difference in nucleosome repeats, and no significant accumulation of known developmentally regulated architectural chromatin proteins. However, histone H3(K9) dimethylation markedly increased while histone H4(K12) acetylation dramatically decreased and became segregated from the histone methylation as chromatin condensed. One histone deacetylase, HDAC5, was significantly upregulated during the terminal stages of Friend virus-infected erythroblast differentiation. Treatment with histone deacetylase inhibitor, trichostatin A, blocked both chromatin condensation and nuclear extrusion. Based on our data, we propose a model for a unique mechanism in which extensive histone deacetylation at pericentromeric heterochromatin mediates heterochromatin condensation in vertebrate erythroblasts that would otherwise be mediated by developmentally-regulated architectural proteins in nucleated blood cells.


Figures

Fig. 1
Fig. 1
Nuclear condensation and extrusion during terminal differentiation of murine erythroblasts in the FVA model system. (A) Bright field micrograph of cytospin preparations at 0 h and 44 h. EB, late erythroblast; open triangle, enucleating erythroblast; R, reticulocyte; N, expelled nucleus. (B) Fluorescence microscopy of 0 and 48 h fixed cells stained with Hoechst 33258 for DNA. (C) Histogram showing nuclear diameter distribution in terminally differentiating murine erythroblasts at 0 h (black bars) and 48 h (gray bars) compared with chicken erythrocytes (open bars). Nuclear diameter measurements were performed by fluorescence microscopy on fixed cells stained with Hoechst 33258 for DNA. Scale bars, 10 μm.
Fig. 2
Fig. 2
Nucleosome repeat length is not substantially changed during terminal differentiation of murine erythroblasts. (A, B) Agarose electrophoresis of DNA isolated from nuclei harvested from erythroblast cultures at 0 h (lanes 2–7, 16) and at 48 h (lanes 8–13, 17). Isolated nuclei were treated with 2.5 units/ml of micrococcal nuclease for 0 (lines 2, 8), 1 (3, 9), 3 (4, 10), 6 (5, 11), 12 (6, 12, 16, 17), and 30 (7, 13) minutes. Lanes 1, 14, and 15 show DNA molecular size markers. (C) Median sizes of the micrococcal nuclease digest bands for the erythroblasts before (0 h, solid line) and after erythropoietin induction (48 h, dotted line) were calculated from densitometry of the gel (A) and plotted against the nucleosome repeat number.
Fig. 3
Fig. 3
Histone composition in differentiating erythroblasts. (A) Total protein from nuclei analyzed by SDS-PAGE and stained with Coomassie R250. Mouse NIH3T3 cells, lanes 1 and 5; chicken erythroblasts from 12-day embryos, lane 2; 15-day chicken embryos, lane 3; adult chicken erythrocytes, lane 4; FVA erythroblasts at 0 h, lane 6; FVA erythroblasts at 48 h, lane 7. (B) Densitometry of lanes 6 and 7 showing that linker histone levels do not change during terminal murine erythroid differentiation. The peaks corresponding to the major linker histone subtypes: H1L (large H1 band) and H1S (small H1 band) and core histones: H2A, H2B, H3, and H4 are indicated. (C) HPLC chromatography of isolated core histones eluted with a linear gradient of 20–43% acetonitrile showing that histone variants do not change during terminal murine erythroid differentiation. Numbers 1–6 correspond to fractions analyzed in Panel D. (D) Pooled HPLC fractions from peaks marked by numbers 1–6 (Panel C) were separated on PAGE to identify by molecular weight the type of histone in each fraction. Inp: input of isolated core histone onto HPLC column.
Fig. 4
Fig. 4
Changes in heterochromatin proteins during erythroid terminal differentiation. (A) Total protein samples from the nuclei of mouse NIH3T3 cells (1), FVA cells before (2) and 48 h after erythropoietin induction (3), chicken erythroblasts from 12-day embryo (4), and adult chicken erythrocytes (5) were separated by SDS-PAGE and Western blots probed with antibodies against HP1α, β, and γ as indicated. The bottom panel showing control core histone (CH) loading was stained with Coomassie R250. (B) Nuclear protein samples were separated by SDS-PAGE and Western blots probed with antibodies against, MeCP2, histone H2AZ, lamins A/C and B1, and MBD2 as indicated. NIH3T3 cells, lane 6; FVA erythroblasts at 0 h, lane 7; and FVA erythroblasts at 48 h, lane 8. Controls stained for histones had equal loads (data not shown). (C) Nuclear protein samples were separated with SDS-PAGE and Western blots probed with antibodies against histones H3ac(K9, K14), H4acK12, H3me2K9 and H3me3K9, as indicated. Mouse NIH3T3 cells: lanes 9, 12; FVA erythroblasts at 0 h: lanes 10, 13, 14; 20 h: lane 15; 32 h: lane 16; 48 h: lanes 11, 17, 18. Lanes 13–14 and 17–18 represent two pairs of independent experiments. The bottom panel was stained with Coomassie R250 for histone loading controls. (D) Histogram showing densitometry of Western blots of NIH3T3 cells and FVA erythroblasts at 0 h and 48 h probed with antibodies to HP1α, β, and γ and antibodies to histones H3ac(K9, K14), H4acK12, H3me2K9 and H3me3K9. The signal intensities in NIH/3T3 were designated as equal to 100%. Error bars show Standard Deviation.
Fig. 5
Fig. 5
Spatial reorganization of histone modifications during erythroblast differentiation. Immunofluorescence microscopy of FVA cells before (0h) and after (48h) erythropoietin induction stained with Hoechst (blue, panels 1–4, 13, 16) for DNA or Hoechst plus antibodies against histones H3me2K9 (red, panels 5, 6), H4acK12 (green, panels 7, 8), and H3me3K9 (red, panels 14, 17) as indicated. Panels 1–4, 13, 16 show original images. Panels 5–8 and 14, 17 show overlayed images obtained after Autodeblur deconvolution (see Materials and Methods). Panels 9–12, 15 and 18 show line profiles (deconvolved images) illustrating the spatial fluorescence intensity changes of the specific antibody staining (red or green channel as indicated) and Hoechst (blue channel) plotted along the paths shown by the yellow lines on panels 5–8, 14 and 17. Scale bar, 10 μm. Panel 19 shows a histogram of average distances between Hoechst peaks and each of the three epigenetic histone modifications: H3me3K9, H3me2K9, and H4acK12. Distances were measured on multiple line profiles (such as those shown on panels 9 – 12, 15, 18) recorded after immunofluorescence deconvolution microscopy of FVA cells before (0h) and after (48h) erythropoietin induction. From 40 to 50 measurements were made for each category. Error bars show Standard Deviations. P-values shown over the brackets represent probability associated with a Student’s two-sample unequal variance t-Test with a two-tailed distribution.
Fig. 6
Fig. 6
Increased mRNA expression of HDAC5 at the late stage of erythroblast differentiation. (A) Histograms showing relative mRNA expression levels (normalized to the maximal level shown as 100%) as determined by quantitative real-time PCR for HDACs 1, 2, 3, 4, 5, 6, 8, 10. For each HDAC, a set of 7 columns represents PCR experiments with cDNA obtained (left to right) from FVA cells incubated with erythropoietin for 0, 8, 16, 24, 32, 40, and 48 h. (B) Total protein samples from the nuclei of mouse FVA cells before (0 h) and 20, 44, and 48 h after erythropoietin induction were separated by SDS-PAGE and Western blots probed with antibodies against HDAC5. The bottom panel shows histones from the same samples stained with Coomassie R250. (C) Immunofluorescence microscopy of FVA cells before (0h) and after (48h) erythropoietin induction stained with Hoechst 33258 (panels 1, 3, 5, 7) for DNA, antibodies against HDAC5 (panels 2, 4, 6, 7) and antibodies against nuclear lamin B (panel 8). Arrows on panels 2, 4 indicate the positions of HDAC5-negative nuclei. Panels 7 and 8 show superimpositions of confocal images (at higher magnification) stained with Hoechst 33258 and anti-HDAC5 (7), and anti-HDAC5 and anti-lamin B (8).
Fig. 7
Fig. 7
Trichostatin A inhibits histone deacetylation, nuclear condensation and nuclear extrusion. (A) Total nuclear proteins were separated on SDS-PAGE and detected by Western blotting with antibodies against acetylated histone H4(K12). FVA erythroblasts were cultured for 24 or 48 h with erythropoietin (lanes 1 and 2) or additionally treated for the final 24 h with 100 (3) or 200 (4) nM TSA and then nuclei were isolated. The bottom panel shows histone loading controls stained with Coomassie R250. (B) Histogram of percent erythroblasts, reticulocytes and expelled nuclei in untreated cultures and in cells cultured for 24 h and then treated for the final 24 h with 100 nM TSA. (C) Examples of cytospin preparations at 44 h of untreated, control erythroblasts and erythroblasts treated with 100 nM TSA. Scale bar, 5 μm. (D) Histogram showing nuclear diameter distribution in cytospin preparations of control and TSA-treated cells at 44 h.
Fig. 8
Fig. 8
Model showing different molecular mechanisms proposed to mediate chromatin condensation in avian (nucleated) erythrocytes vs. mammalian erythroblasts before enucleation. (a) In proliferating cells histone H3me2K9 (square flags) is interspersed with histone acetylation (circle signs) in the euchromatin. Histone H3me3K9 (triangle flags) and HP1 are associated with pericentromeric heterochromatin. (b) During terminal differentiation in avian erythrocytes, the chromatin condensing factors (H5 and MENT) replace HP1 and cause chromatin condensation at multiple and dispersed foci of facultative heterochromatin marked by H3me2K9. Active chromosomal domains are structurally insulated by boundary elements (open triangles) that inhibit spreading of chromatin condensing factors onto active genes. (c) In differentiating mammalian erythroblasts, HP1 is also removed from the chromatin but is not replaced by another chromatin-condensing architectural factor. Instead, the increased histone methyl transferase and HDAC activities lead to a sharp decrease in histone acetylation in the apocentric zone formed around the constitutive heterochromatin. The apocentric chromatin condenses as a result of loss of histone acetylation and, by the end of the differentiation process, forms a facultative heterochromatin territory spatially segregated from the residual active chromatin territory remaining at the nuclear periphery.

Similar articles

Cited by

References

    1. Adkins NL, Watts M, Georgel PT. To the 30-nm chromatin fiber and beyond. Biochim Biophys Acta. 2004;1677:12–23. - PubMed
    1. Bannister AJ, Schneider R, Myers FA, Thorne AW, Crane-Robinson C, Kouzarides T. Spatial distribution of Di- and tri-methyl lysine 36 of histone H3 at active genes. J Biol Chem. 2005;280:17732–17736. - PubMed
    1. Bates DL, Thomas JO. Histones H1 and H5: one or two molecules per nucleosome? Nucleic Acids Res. 1981;9:5883–5894. - PMC - PubMed
    1. Bernstein E, Allis CD. RNA meets chromatin. Genes Dev. 2005;19:1635–1655. - PubMed
    1. Brero A, Easwaran HP, Nowak D, Grunewald I, Cremer T, Leonhardt H, Cardoso MC. Methyl CpG-binding proteins induce large-scale chromatin reorganization during terminal differentiation. J Cell Biol. 2005;169:733–743. - PMC - PubMed

Publication types