

Advanced time-series analysis of MEG data as a method to explore olfactory function in healthy controls and Parkinson's disease patients
- PMID: 19172623
- PMCID: PMC6870711
- DOI: 10.1002/hbm.20726
Advanced time-series analysis of MEG data as a method to explore olfactory function in healthy controls and Parkinson's disease patients
Abstract
Objectives: To determine whether time-series analysis of magnetoencephalography (MEG) data is a suitable method to study brain activity related to olfactory information processing, and to detect differences in odor-induced brain activity between patients with Parkinson's disease (PD) and controls.
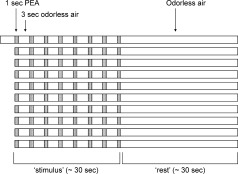
Methods: Whole head 151-channel MEG recordings were obtained in 21 controls and 20 patients with PD during a 10-min olfactory stimulus paradigm, consisting of 10 alternating rest-stimulus cycles (30 s each), using phenylethyl alcohol administered by means of a Burghart olfactometer. Relative spectral power and synchronization likelihood (SL; an unbiased measure of functional connectivity) were calculated for delta, theta, alpha1, alpha2, beta, and gamma frequency bands.
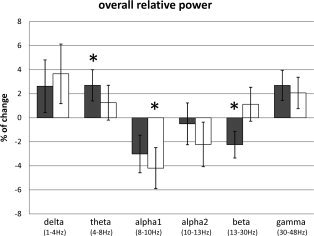
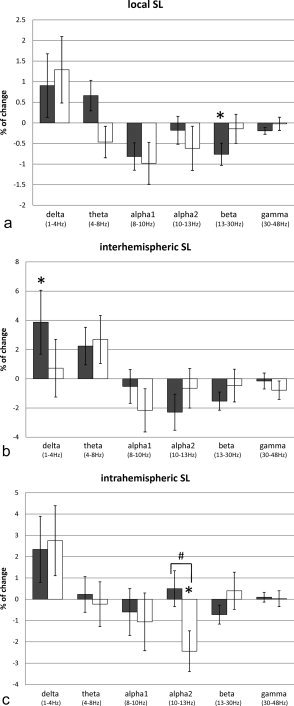
Results: In controls, olfactory stimulation produced an increase in theta power and a decrease in beta power. In patients with PD, there was a decrease in alpha1 power. No significant interaction between group and condition was found for spectral power. SL analysis revealed a significantly different response to olfactory stimulation in patients with PD compared to controls. In controls, the odor stimulus induced a decrease in local beta band SL. The response in patients with PD involved a decrease in intrahemispheric alpha2 band SL.
Conclusion: This is the first study to show that time-series analysis of MEG data, including spectral power and SL, can be used to detect odor-induced changes in brain activity. In addition, differences in odor-induced brain activity were found between patients with PD and controls using analysis of SL, but not of spectral power.
2009 Wiley-Liss, Inc.
Figures
Similar articles
-
Increased cortico-cortical functional connectivity in early-stage Parkinson's disease: an MEG study.Neuroimage. 2008 Jun;41(2):212-22. doi: 10.1016/j.neuroimage.2008.02.027. Epub 2008 Feb 29. Neuroimage. 2008. PMID: 18395468
-
Slowing of oscillatory brain activity is a stable characteristic of Parkinson's disease without dementia.Brain. 2007 Jul;130(Pt 7):1847-60. doi: 10.1093/brain/awm034. Epub 2007 Apr 5. Brain. 2007. PMID: 17412733
-
Quantitative EEG analysis in post-traumatic anosmia.Brain Res Bull. 2006 Dec 11;71(1-3):69-75. doi: 10.1016/j.brainresbull.2006.08.004. Epub 2006 Sep 1. Brain Res Bull. 2006. PMID: 17113930
-
Evaluation of olfactory dysfunction in neurodegenerative diseases.J Neurol Sci. 2012 Dec 15;323(1-2):16-24. doi: 10.1016/j.jns.2012.08.028. Epub 2012 Sep 23. J Neurol Sci. 2012. PMID: 23010543 Review.
-
Olfaction in Parkinson's disease and related disorders.Neurobiol Dis. 2012 Jun;46(3):527-52. doi: 10.1016/j.nbd.2011.10.026. Epub 2011 Dec 20. Neurobiol Dis. 2012. PMID: 22192366 Free PMC article. Review.
Cited by
-
Neuromapping olfactory stimulation using magnetoencephalography - visualizing smell, a proof-of-concept study.Front Allergy. 2023 Jan 9;3:1019265. doi: 10.3389/falgy.2022.1019265. eCollection 2022. Front Allergy. 2023. PMID: 36698377 Free PMC article.
-
A systematic review of MEG-based studies in Parkinson's disease: The motor system and beyond.Hum Brain Mapp. 2019 Jun 15;40(9):2827-2848. doi: 10.1002/hbm.24562. Epub 2019 Mar 7. Hum Brain Mapp. 2019. PMID: 30843285 Free PMC article.
-
Functional Connectivity of the Chemosenses: A Review.Front Syst Neurosci. 2022 Jun 22;16:865929. doi: 10.3389/fnsys.2022.865929. eCollection 2022. Front Syst Neurosci. 2022. PMID: 35813269 Free PMC article. Review.
-
Magnetoencephalography as a Tool in Psychiatric Research: Current Status and Perspective.Biol Psychiatry Cogn Neurosci Neuroimaging. 2017 Apr;2(3):235-244. doi: 10.1016/j.bpsc.2017.01.005. Biol Psychiatry Cogn Neurosci Neuroimaging. 2017. PMID: 28424797 Free PMC article. Review.
-
Imaging advances to detect non-motor prodromal markers of Parkinson's disease and explore therapeutic translation opportunities.NPJ Parkinsons Dis. 2025 Jun 18;11(1):174. doi: 10.1038/s41531-025-01004-0. NPJ Parkinsons Dis. 2025. PMID: 40533452 Free PMC article. Review.
References
-
- Aftanas LI,Varlamov AA,Pavlov SV,Makhnev VP,Reva NV ( 2001): Affective picture processing: Event‐related synchronization within individually defined human theta band is modulated by valence dimension. Neurosci Lett 303: 115–118. - PubMed
-
- Ansari KA,Johnson A ( 1975): Olfactory function in patients with Parkinson's disease. J Chronic Dis 28: 493–497. - PubMed
-
- Barz S,Hummel T,Pauli E,Majer M,Lang CJG,Kobal G ( 1997): Chemosensory event‐related potentials in response to trigeminal and olfactory stimulation in idiopathic Parkinson's disease. Neurology 49: 1424–1431. - PubMed
-
- Başar E,Schürmann M,Sakowitz O ( 2001): The selectively distributed theta system: Functions. Int J Psychophysiol 39: 197–212. - PubMed
-
- Berendse HW,Booij J,Francot CMJE,Bergmans PLM,Hijman R,Stoof JC,Wolters ECh ( 2001): Subclinical dopaminergic dysfunction in asymptomatic Parkinson's disease patients' relatives with a decreased sense of smell. Ann Neurol 50: 34–41. - PubMed
Publication types
MeSH terms
LinkOut - more resources
Full Text Sources
Medical
