

Functional connectivity between the thalamus and visual cortex under eyes closed and eyes open conditions: a resting-state fMRI study
- PMID: 19172624
- PMCID: PMC2733938
- DOI: 10.1002/hbm.20728
Functional connectivity between the thalamus and visual cortex under eyes closed and eyes open conditions: a resting-state fMRI study
Abstract
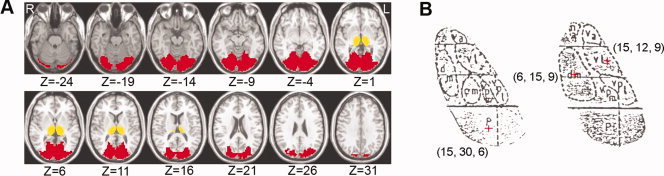
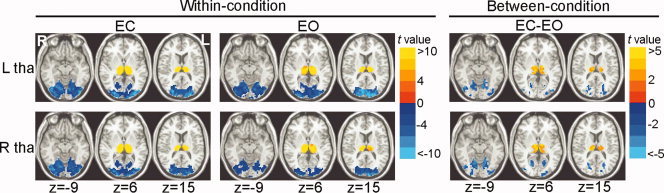
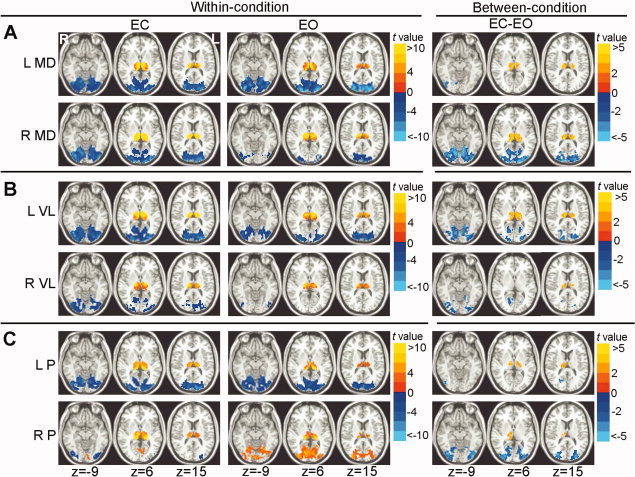
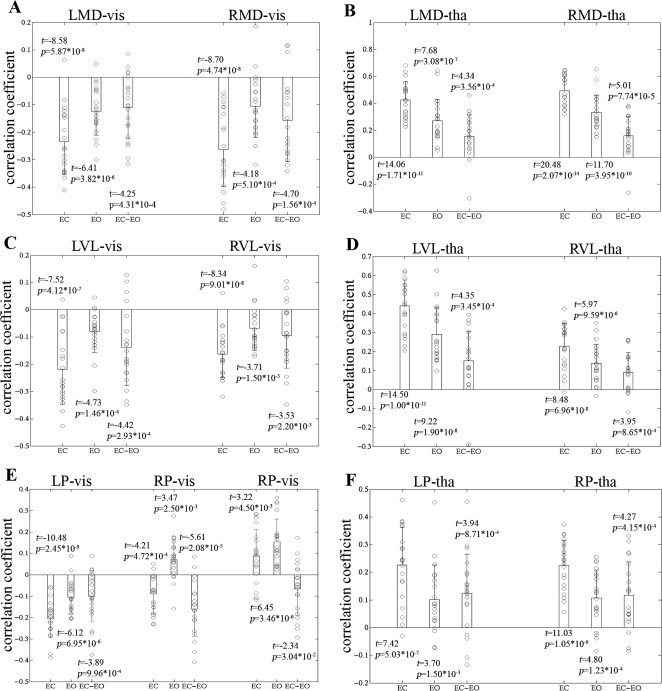
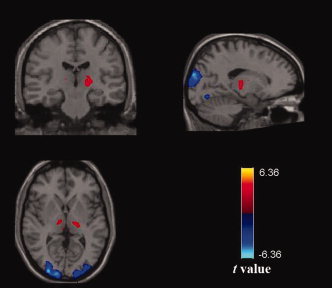
The thalamus and visual cortex are two key components associated with the alpha power of electroencephalography. However, their functional relationship remains to be elucidated. Here, we employ resting-state functional MRI to investigate the temporal correlations of spontaneous fluctuations between the thalamus [the whole thalamus and its three largest nuclei (bilateral mediodorsal, ventrolateral and pulvinar nuclei)] and visual cortex under both eyes open and eyes closed conditions. The whole thalamus show negative correlations with the visual cortex and positive correlations with its contralateral counterpart in eyes closed condition, but which are significantly decreased in eyes open condition, consistent with previous findings of electroencephalography desynchronization during eyes open resting state. Furthermore, we find that bilateral thalamic mediodorsal nuclei and bilateral ventrolateral nuclei have remarkably similar connectivity maps, and resemble to those of the whole thalamus, suggesting their crucial contributions to the thalamus-visual correlations. The bilateral pulvinar nuclei are found to show distinct functional connectivity patterns, compatible with previous findings of the asymmetry of anatomical and functional organization in the nuclei. Our data provides evidence for the associations of intrinsic spontaneous neuronal activity between the thalamus and visual cortex under different resting conditions, which might have implications on the understanding of the generation and modulation of the alpha rhythm.
2009 Wiley-Liss, Inc.
Figures


Similar articles
-
Visual thalamocortical projections in the flying fox: parallel pathways to striate and extrastriate areas.Neuroscience. 2005;130(2):497-511. doi: 10.1016/j.neuroscience.2004.09.047. Neuroscience. 2005. PMID: 15664706
-
Resting-State Functional Connectivity of the Thalamus in Complete Spinal Cord Injury.Neurorehabil Neural Repair. 2020 Feb;34(2):122-133. doi: 10.1177/1545968319893299. Epub 2020 Jan 6. Neurorehabil Neural Repair. 2020. PMID: 31904298
-
Magnetic resonance imaging of mediodorsal, pulvinar, and centromedian nuclei of the thalamus in patients with schizophrenia.Arch Gen Psychiatry. 2003 Oct;60(10):983-91. doi: 10.1001/archpsyc.60.9.983. Arch Gen Psychiatry. 2003. PMID: 14557143
-
Arterial Supply of the Thalamus: A Comprehensive Review.World Neurosurg. 2020 May;137:310-318. doi: 10.1016/j.wneu.2020.01.237. Epub 2020 Feb 7. World Neurosurg. 2020. PMID: 32036065 Review.
-
A review of cat and monkey studies implicating the pulvinar in visual function.Behav Biol. 1977 Jun;20(2):149-67. doi: 10.1016/s0091-6773(77)90721-0. Behav Biol. 1977. PMID: 409388 Review. No abstract available.
Cited by
-
Systemic physiology augmented functional near-infrared spectroscopy hyperscanning: a first evaluation investigating entrainment of spontaneous activity of brain and body physiology between subjects.Neurophotonics. 2022 Apr;9(2):026601. doi: 10.1117/1.NPh.9.2.026601. Epub 2022 Apr 18. Neurophotonics. 2022. PMID: 35449706 Free PMC article.
-
Altered inter- and intrahemispheric functional connectivity dynamics in autistic children.Hum Brain Mapp. 2020 Feb 1;41(2):419-428. doi: 10.1002/hbm.24812. Epub 2019 Oct 10. Hum Brain Mapp. 2020. PMID: 31600014 Free PMC article.
-
Embedding Dimension Selection for Adaptive Singular Spectrum Analysis of EEG Signal.Sensors (Basel). 2018 Feb 26;18(3):697. doi: 10.3390/s18030697. Sensors (Basel). 2018. PMID: 29495415 Free PMC article.
-
Reproducibility of R-fMRI metrics on the impact of different strategies for multiple comparison correction and sample sizes.Hum Brain Mapp. 2018 Jan;39(1):300-318. doi: 10.1002/hbm.23843. Epub 2017 Oct 11. Hum Brain Mapp. 2018. PMID: 29024299 Free PMC article.
-
Long-term effects of attentional performance on functional brain network topology.PLoS One. 2013 Sep 9;8(9):e74125. doi: 10.1371/journal.pone.0074125. eCollection 2013. PLoS One. 2013. PMID: 24040185 Free PMC article.
References
-
- Adams MM,Hof PR,Gattass R,Webster MJ,Ungerleider LG ( 2000): Visual cortical projections and chemoarchitecture of macaque monkey pulvinar. J Comp Neurol 419: 377–393. - PubMed
-
- Andersen P,Andersson SA ( 1968): Physiological Basis of the Alpha Rhythm. New York: Appleton‐Century‐Crofts; 235 p.
-
- Baker JT,Patel GH,Corbetta M,Snyder LH ( 2006): Distribution of activity across the monkey cerebral cortical surface, thalamus and midbrain during rapid, visually guided saccades. Cereb Cortex 16: 447–459. - PubMed
-
- Behrens TE,Johansen‐Berg H,Woolrich MW,Smith SM,Wheeler‐Kingshott CA,Boulby PA,Barker GJ,Sillery EL,Sheehan K,Ciccarelli O,Thompson AJ,Brady JM,Matthews PM ( 2003): Non‐invasive mapping of connections between human thalamus and cortex using diffusion imaging. Nat Neurosci 6: 750–757. - PubMed
Publication types
MeSH terms
Grants and funding
LinkOut - more resources
Full Text Sources
