. 2009 Sep;30(9):2766-88.
doi: 10.1002/hbm.20708.

Automated 3D mapping of hippocampal atrophy and its clinical correlates in 400 subjects with Alzheimer's disease, mild cognitive impairment, and elderly controls

Affiliations

Automated 3D mapping of hippocampal atrophy and its clinical correlates in 400 subjects with Alzheimer's disease, mild cognitive impairment, and elderly controls

Jonathan H Morra et al. Hum Brain Mapp. 2009 Sep.

Abstract

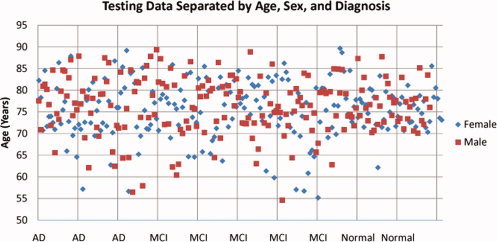
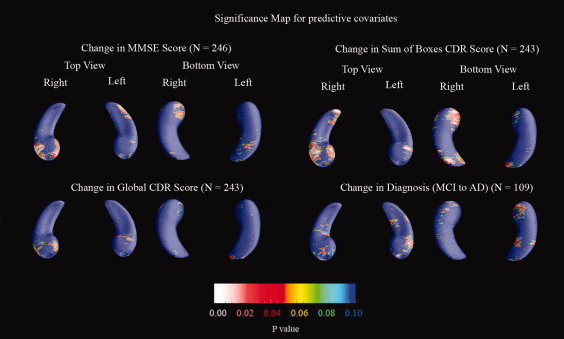
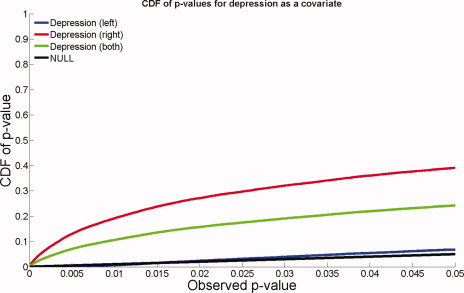
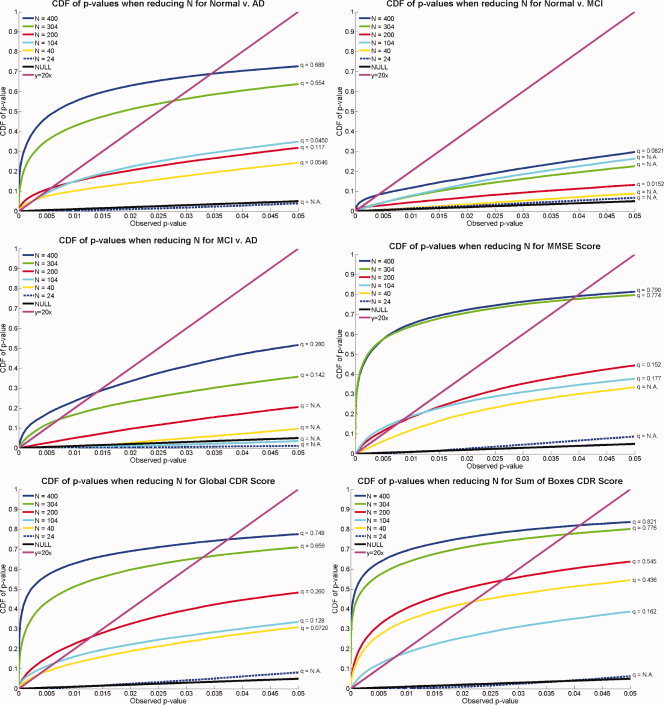
We used a new method we developed for automated hippocampal segmentation, called the auto context model, to analyze brain MRI scans of 400 subjects from the Alzheimer's disease neuroimaging initiative. After training the classifier on 21 hand-labeled expert segmentations, we created binary maps of the hippocampus for three age- and sex-matched groups: 100 subjects with Alzheimer's disease (AD), 200 with mild cognitive impairment (MCI) and 100 elderly controls (mean age: 75.84; SD: 6.64). Hippocampal traces were converted to parametric surface meshes and a radial atrophy mapping technique was used to compute average surface models and local statistics of atrophy. Surface-based statistical maps visualized links between regional atrophy and diagnosis (MCI versus controls: P = 0.008; MCI versus AD: P = 0.001), mini-mental state exam (MMSE) scores, and global and sum-of-boxes clinical dementia rating scores (CDR; all P < 0.0001, corrected). Right but not left hippocampal atrophy was associated with geriatric depression scores (P = 0.004, corrected); hippocampal atrophy was not associated with subsequent decline in MMSE and CDR scores, educational level, ApoE genotype, systolic or diastolic blood pressure measures, or homocysteine. We gradually reduced sample sizes and used false discovery rate curves to examine the method's power to detect associations with diagnosis and cognition in smaller samples. Forty subjects were sufficient to discriminate AD from normal and correlate atrophy with CDR scores; 104, 200, and 304 subjects, respectively, were required to correlate MMSE with atrophy, to distinguish MCI from normal, and MCI from AD.


Figures

Figure 1
Figure 1
A visual representation of the testing data set. This plot shows a breakdown of all subjects by age, sex, and diagnosis. The points have been spread out along the horizontal axis to make it easier to see members of each diagnostic group. [Color figure can be viewed in the online issue, which is available at www.interscience.wiley.com.]
Figure 2
Figure 2
Volumetric analysis for the three different diagnostic groups. Within each diagnostic group, the left hippocampus is slightly smaller than the right; this was only significant for the MCI group in all subjects (P = 0.0068) and the female MCI group (P = 0.00842). The error bars represent standard errors of the mean. [Color figure can be viewed in the online issue, which is available at www.interscience.wiley.com.]
Figure 3
Figure 3
Significance maps (P‐value maps) show strong associations between hippocampal shape (local volumetric atrophy) and diagnosis (left columns) and cognitive and clinical scores (right columns), where blue implies 0.1 or greater. All six maps show strong statistical correlations that were confirmed in permutation tests. The right hippocampal head shows greater atrophy in MCI versus normal groups; the right hippocampal tail shows atrophy only in AD‐MCI and AD‐control comparisons. Most hippocampal regions show greater atrophy in AD than MCI. For the diagnostic comparisons, we used the number of subjects in each of the two groups being compared, for the clinical measurement groups, we used all 400 subjects. [Color figure can be viewed in the online issue, which is available at www.interscience.wiley.com.]
Figure 4
Figure 4
Cumulative distribution functions (CDFs) of significance maps for factors previously associated with hippocampal volumes in AD studies. According to the FDR formulae, the rightmost intersection of the y = 20x line and the CDF for a significance map, other than the origin, represents the q‐value, that is, the highest P‐value threshold for which there are at most 5% false positives. When CDFs cross the line y = 20x at a point other than the origin, there is a significant effect, that is, the map can be thresholded in a way that keeps the proportion of false positives under 5%. If other factors are equal (such as sample size), in general, a larger q‐value indicates a more powerful correlation between the covariate and the level of atrophy, in the sense that there is a broader range of statistic thresholds that can be used to limit the rate of false positives to at most 5%. The AD group was powerfully distinguished from controls (blue line) and from MCI (red line), with a q‐value of 0.280, which implies that 28.0% of the P‐map has significant P‐values (less than 0.05), the highest allowable threshold that still controlled the FDR. Here the sum‐of‐boxes CDR (top trace) is the clinical measure correlating most strongly with atrophy. MMSE and global CDR (dotted lines) show relatively powerful linkages. AD was powerfully distinguished from controls (blue line) and from MCI (red line), with over 1/4 of the hippocampal surface showing significant differences at the highest allowable threshold that still controlled the FDR. In these maps, statistics from left and right HP surfaces are pooled. The y‐value at the intersection point between the CDF and the line y = 20x may be thought of as the proportion of the hippocampal surface in which there are significant results, while keeping the proportion of false positives under 5%. [Color figure can be viewed in the online issue, which is available at www.interscience.wiley.com.]
Figure 5
Figure 5
Correlation coefficients (r‐maps) for the three diagnostic comparisons, showing the strength of association between radial hippocampal size and diagnosis, as well as with cognitive and clinical scores. The correlations in the MMSE map are positive (blue colors) because a higher MMSE score is associated with less degeneration (opposite to all the other ones). These maps correlate very closely with the corresponding P‐maps, and so they are not shown for the other covariates. Note that in general, the correlations with radial atrophy are around 0.4, in regions where significant correlations are detected, which is very similar to the level of correlations between overall hippocampal volumes and the same clinical measures (in Table V). [Color figure can be viewed in the online issue, which is available at www.interscience.wiley.com.]
Figure 6
Figure 6
These are the P‐maps for clinical covariates broken down by diagnosis, where blue implies P‐values of 0.1 or greater. They show where a correlation between radial atrophy and clinical score can be detected within each of the three diagnostic groups. The significance of each of these maps, assessed by permutation, is shown in Table V. Associations with sum‐of‐boxes CDR (left panels) are very strong for both left and right hippocampi in AD and MCI, but not in controls. The global CDR scores (middle panels) associate with atrophy only in AD, but not in MCI or controls, as all MCI patients have a global CDR value of 0.5 and all controls have a global CDR of 0. Associations with MMSE are weaker than expected (only significant in MCI on the right), perhaps because MMSE was used to help define diagnosis, leading to a very restricted range of MMSE scores in each map. [Color figure can be viewed in the online issue, which is available at www.interscience.wiley.com.]
Figure 7
Figure 7
Statistical maps (P‐maps) of group differences and clinical correlates of hippocampal atrophy, computed after controlling for ApoE genotype (coded as noted in the methods), sex, and age (for the maps in the left column) and after controlling for ApoE, sex, age, and diagnosis (for the maps in the right column). The primary covariate of interest is indicated above each set of maps. Blue in the map signifies 0.1 or greater. [Color figure can be viewed in the online issue, which is available at www.interscience.wiley.com.]
Figure 8
Figure 8
Significance maps for the correlation between hippocampal shape at baseline and subsequent change in clinical scores or diagnosis over the following year, where blue denotes 0.1 or greater. The sample size is smaller for these maps (noted in parentheses for each map), as not all subjects had follow‐up scans at the time of this study. For the conversion map, only those who were MCI at baseline and had a one‐year follow‐up diagnosis were included. [Color figure can be viewed in the online issue, which is available at www.interscience.wiley.com.]
Figure 9
Figure 9
Significance maps for ApoE4 as the covariate, with blue being P‐values of 0.1 or higher. We ran two tests, first to determine if the ApoE4 allele was linked with hippocampal atrophy in all subjects (including those with AD), and secondly in just the non‐AD subjects. None of these maps was significant after permutation testing was used for multiple comparisons correction. [Color figure can be viewed in the online issue, which is available at www.interscience.wiley.com.]
Figure 10
Figure 10
Significance maps for other covariates including systolic and diastolic blood pressure, homocysteine levels, years of education, and depression (based on geriatric depression scores), with blue being 0.1 or more. Each map has some areas of significance; however only depression has a correlation with atrophy that is significant after permutation testing (for the right hippocampus). [Color figure can be viewed in the online issue, which is available at www.interscience.wiley.com.]
Figure 11
Figure 11
FDR analysis with depression as a covariate. Atrophy of the right hippocampus was correlated with depression scores, but no linkage was detected for the left hippocampus. [Color figure can be viewed in the online issue, which is available at www.interscience.wiley.com.]
Figure 12
Figure 12
Effects of varying the sample size: CDFs of P‐values measuring the effect sizes for correlations between hippocampal atrophy and different covariates, as the sample size, N, decreases. In general, greater effect sizes are shown by CDFs with the most rapid upswings from the origin. In almost all cases, the results based on smaller sample sizes show lower effect sizes than those computed from larger samples. There is not a monotonically increasing relation between sample size and the height of the CDF computed from the sample, as each sample is the result of random sampling from a population. In general however, as N decreases, the power to detect a given effect is less. The minimal effective sample sizes differ for different effects. [Color figure can be viewed in the online issue, which is available at www.interscience.wiley.com.]

Similar articles

Cited by

References

    1. Aganj I,Sapiro G,Parikshak N,Madsen SK,Thompson PM ( 2008): Segmentation‐free measurement of cortical thickness from MRI In: Proceedings of the Conference on Information Science and Biomedical Imaging (ISBI). pp 1625–1628. - PMC - PubMed
    1. Apostolova LG,Thompson PM ( 2007): Brain mapping as a tool to study neurodegeneration. Neurotherapeutics 4: 387–400. - PMC - PubMed
    1. Apostolova LG,Dinov ID,Dutton RA,Hayashi KM,Toga AW,Cummings JL,Thompson PM ( 2006a): 3D comparison of hippocampal atrophy in amnestic mild cognitive impairment and Alzheimer's disease. Brain 129(Pt 11): 2867–2873. - PubMed
    1. Apostolova LG,Dutton RA,Dinov ID,Hayashi KM,Toga AW,Cummings JL,Thompson PM ( 2006b): Conversion of mild cognitive impairment to Alzheimer disease predicted by hippocampal atrophy maps. Arch Neurol 63: 693–699. - PubMed
    1. Apostolova LG,Akopyan GG,Partiali N,Steiner CA,Dutton RA,Hayashi KM,Dinov ID,Toga AW,Cummings JL,Thompson PM ( 2007): Structural correlates of apathy in Alzheimer's disease. Dement Geriatr Cogn Disord 24: 91–97. - PubMed

Publication types

MeSH terms