

Activated region fitting: a robust high-power method for fMRI analysis using parameterized regions of activation
- PMID: 19172652
- PMCID: PMC6870927
- DOI: 10.1002/hbm.20697
Activated region fitting: a robust high-power method for fMRI analysis using parameterized regions of activation
Abstract
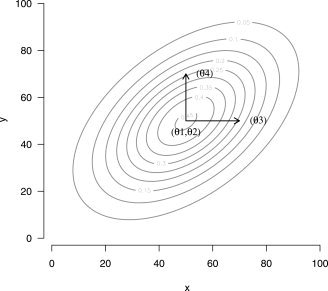
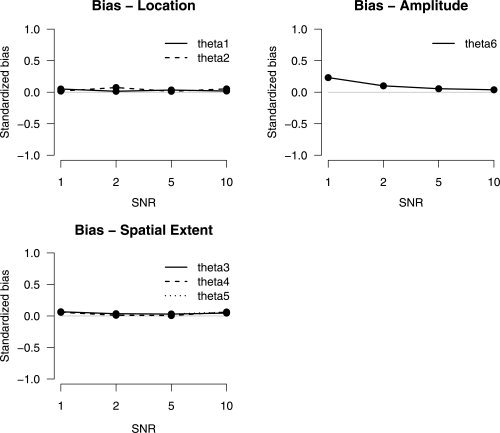
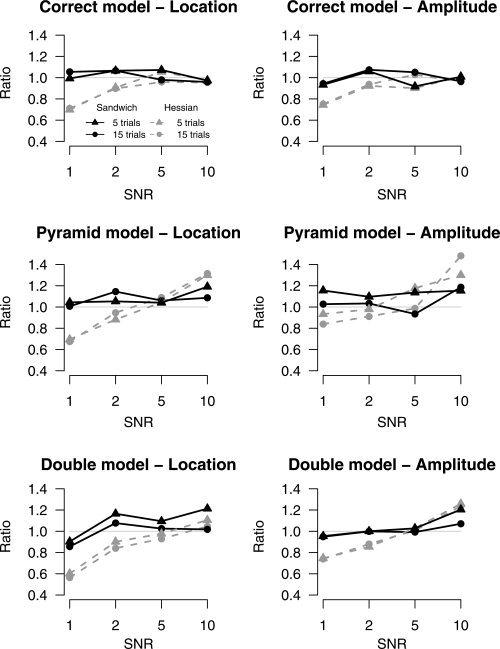
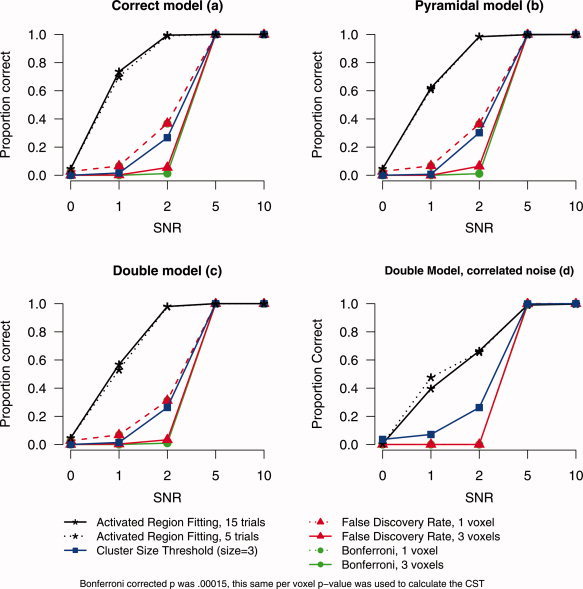
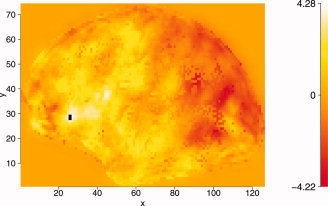
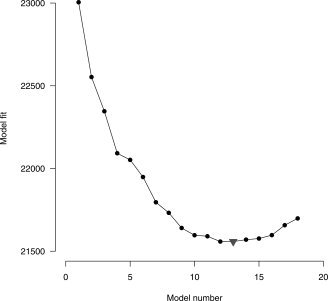
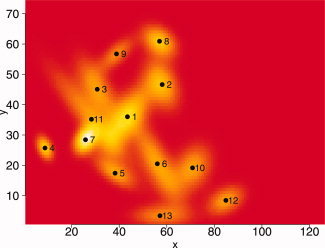
An important issue in the analysis of fMRI is how to account for the spatial smoothness of activated regions. In this article a method is proposed to accomplish this by modeling activated regions with Gaussian shapes. Hypothesis tests on the location, spatial extent, and amplitude of these regions are performed instead of hypothesis tests of individual voxels. This increases power and eases interpretation. Simulation studies show robust hypothesis tests under misspecification of the shape model, and increased power over standard techniques especially at low signal-to-noise ratios. An application to real single-subject data also indicates that the method has increased power over standard methods.
(c) 2009 Wiley-Liss, Inc.
Figures
Similar articles
-
An evaluation of spatial thresholding techniques in fMRI analysis.Hum Brain Mapp. 2008 Dec;29(12):1379-89. doi: 10.1002/hbm.20471. Hum Brain Mapp. 2008. PMID: 18064589 Free PMC article.
-
Spatially adaptive mixture modeling for analysis of FMRI time series.IEEE Trans Med Imaging. 2010 Apr;29(4):1059-74. doi: 10.1109/TMI.2010.2042064. Epub 2010 Mar 25. IEEE Trans Med Imaging. 2010. PMID: 20350840
-
Modeling state-related fMRI activity using change-point theory.Neuroimage. 2007 Apr 15;35(3):1125-41. doi: 10.1016/j.neuroimage.2007.01.004. Epub 2007 Jan 23. Neuroimage. 2007. PMID: 17360198
-
Unsupervised learning and mapping of active brain functional MRI signals based on hidden semi-Markov event sequence models.IEEE Trans Med Imaging. 2005 Feb;24(2):263-76. doi: 10.1109/tmi.2004.841225. IEEE Trans Med Imaging. 2005. PMID: 15707252
-
Denoising functional MR images: a comparison of wavelet denoising and Gaussian smoothing.IEEE Trans Med Imaging. 2004 Mar;23(3):374-87. doi: 10.1109/TMI.2004.824234. IEEE Trans Med Imaging. 2004. PMID: 15027530
Cited by
-
Optimizing the performance of local canonical correlation analysis in fMRI using spatial constraints.Hum Brain Mapp. 2012 Nov;33(11):2611-26. doi: 10.1002/hbm.21388. Epub 2011 Aug 30. Hum Brain Mapp. 2012. PMID: 23074078 Free PMC article.
-
Characterizing cross-subject spatial interaction patterns in functional magnetic resonance imaging studies: A two-stage point-process model.Biom J. 2017 Nov;59(6):1352-1381. doi: 10.1002/bimj.201600212. Epub 2017 Jul 12. Biom J. 2017. PMID: 28699334 Free PMC article.
-
Robust and unbiased variance of GLM coefficients for misspecified autocorrelation and hemodynamic response models in fMRI.Int J Biomed Imaging. 2009;2009:723912. doi: 10.1155/2009/723912. Epub 2009 Sep 6. Int J Biomed Imaging. 2009. PMID: 19746181 Free PMC article.
-
3D spatially-adaptive canonical correlation analysis: Local and global methods.Neuroimage. 2018 Apr 1;169:240-255. doi: 10.1016/j.neuroimage.2017.12.025. Epub 2017 Dec 14. Neuroimage. 2018. PMID: 29248697 Free PMC article.
References
-
- Bowman FD ( 2005): Spatio‐temporal modeling of localized brain activity. Biostatistics 6: 558–575. - PubMed
-
- Fears TR,Benichou J,Gail MH ( 1996): A reminder of the fallibility of the Wald statistic. Am Stat 50: 225–226.
-
- Flandin G,Penny W ( 2007): Bayesian fMRI data analysis with sparse spatial basis function priors. Neuroimage 34: 1108–1125. - PubMed
-
- Forman SD,Cohen JD,Fitzgerald M,Eddy WF,Mintum MA,Noll DC ( 1995): Improved assessment of significant activation in functional magnetic resonance imaging (fMRI): Use of a cluster‐size threshold. Magn Reson Med 33: 636–647. - PubMed
Publication types
MeSH terms
LinkOut - more resources
Full Text Sources
Medical
