

Increased expression of the Hutchinson-Gilford progeria syndrome truncated lamin A transcript during cell aging
- PMID: 19172989
- PMCID: PMC2986496
- DOI: 10.1038/ejhg.2008.270
Increased expression of the Hutchinson-Gilford progeria syndrome truncated lamin A transcript during cell aging
Abstract
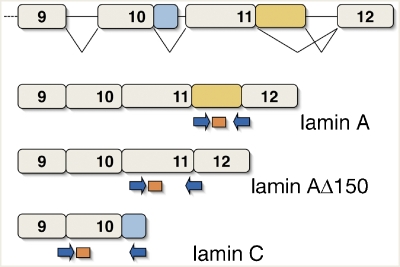
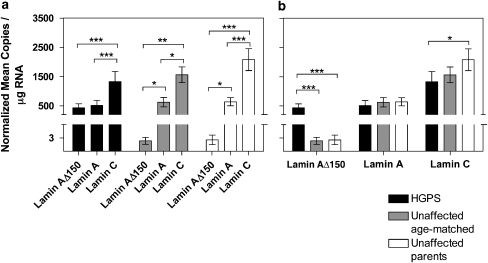
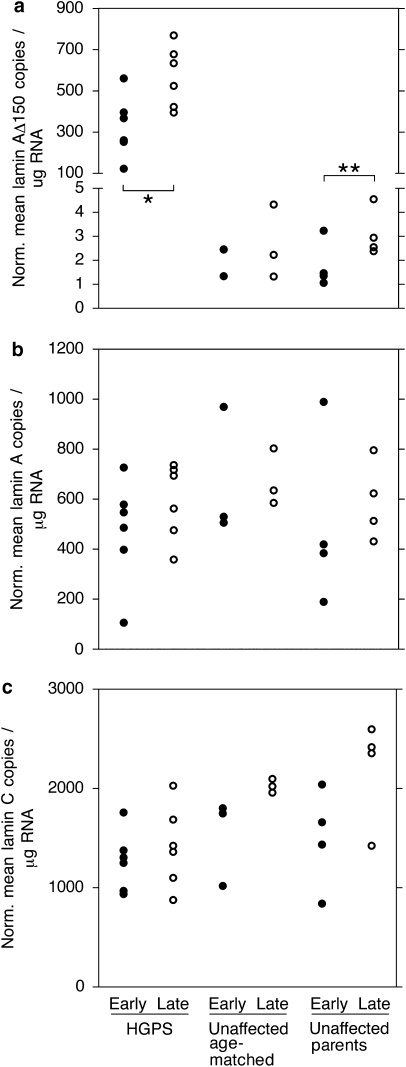
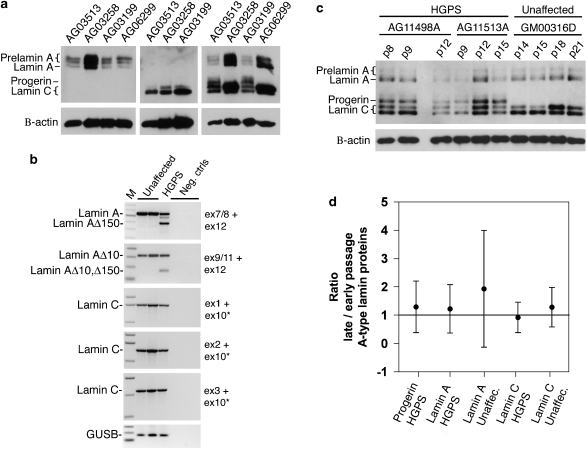
Most cases of the segmental progeroid syndrome, Hutchinson-Gilford progeria syndrome (HGPS), are caused by a de novo dominant mutation within a single codon of the LMNA gene. This mutation leads to the increased usage of an internal splice site that generates an alternative lamin A transcript with an internal deletion of 150 nucleotides, called lamin A Delta 150. The LMNA gene encodes two major proteins of the inner nuclear lamina, lamins A and C, but not much is known about their expression levels. Determination of the overall expression levels of the LMNA gene transcripts is an important step to further the understanding of the HGPS. In this study, we have performed absolute quantification of the lamins A, C and A Delta 150 transcripts in primary dermal fibroblasts from HGPS patients and unaffected age-matched and parent controls. We show that the lamin A Delta 150 transcript is present in unaffected controls but its expression is >160-fold lower than that in samples from HGPS patients. Analysis of transcript expression during in vitro aging shows that although the levels of lamin A and lamin C transcripts remain unchanged, the lamin A Delta 150 transcript increases in late passage cells from HGPS patients and parental controls. This study provides a new method for LMNA transcript analysis and insights into the expression of the LMNA gene in HGPS and normal cells.
Figures
Similar articles
-
Hutchinson-Gilford progeria syndrome.Clin Genet. 2004 Nov;66(5):375-81. doi: 10.1111/j.1399-0004.2004.00315.x. Clin Genet. 2004. PMID: 15479179 Review.
-
Cellular stress and AMPK activation as a common mechanism of action linking the effects of metformin and diverse compounds that alleviate accelerated aging defects in Hutchinson-Gilford progeria syndrome.Med Hypotheses. 2018 Sep;118:151-162. doi: 10.1016/j.mehy.2018.06.029. Epub 2018 Jun 28. Med Hypotheses. 2018. PMID: 30037605
-
Identification of novel RNA isoforms of LMNA.Nucleus. 2017 Sep 3;8(5):573-582. doi: 10.1080/19491034.2017.1348449. Epub 2017 Aug 31. Nucleus. 2017. PMID: 28857661 Free PMC article.
-
Dermal fibroblasts in Hutchinson-Gilford progeria syndrome with the lamin A G608G mutation have dysmorphic nuclei and are hypersensitive to heat stress.BMC Cell Biol. 2005 Jun 27;6:27. doi: 10.1186/1471-2121-6-27. BMC Cell Biol. 2005. PMID: 15982412 Free PMC article.
-
Epigenetic involvement in Hutchinson-Gilford progeria syndrome: a mini-review.Gerontology. 2014;60(3):197-203. doi: 10.1159/000357206. Epub 2014 Feb 28. Gerontology. 2014. PMID: 24603298 Review.
Cited by
-
Defective lamin A-Rb signaling in Hutchinson-Gilford Progeria Syndrome and reversal by farnesyltransferase inhibition.PLoS One. 2010 Jun 15;5(6):e11132. doi: 10.1371/journal.pone.0011132. PLoS One. 2010. PMID: 20559568 Free PMC article.
-
Mechanisms of allelic and clinical heterogeneity of lamin A/C phenotypes.Physiol Genomics. 2018 Sep 1;50(9):694-704. doi: 10.1152/physiolgenomics.00128.2017. Epub 2018 May 11. Physiol Genomics. 2018. PMID: 29750601 Free PMC article. Review.
-
Global genome splicing analysis reveals an increased number of alternatively spliced genes with aging.Aging Cell. 2016 Apr;15(2):267-78. doi: 10.1111/acel.12433. Epub 2015 Dec 21. Aging Cell. 2016. PMID: 26685868 Free PMC article.
-
Repression of the Antioxidant NRF2 Pathway in Premature Aging.Cell. 2016 Jun 2;165(6):1361-1374. doi: 10.1016/j.cell.2016.05.017. Cell. 2016. PMID: 27259148 Free PMC article.
-
Human CaaX protease ZMPSTE24 expressed in yeast: Structure and inhibition by HIV protease inhibitors.Protein Sci. 2017 Feb;26(2):242-257. doi: 10.1002/pro.3074. Epub 2016 Nov 11. Protein Sci. 2017. PMID: 27774687 Free PMC article.
References
-
- Martin GM. Genetic modulation of senescent phenotypes in Homo sapiens. Cell. 2005;120:523–532. - PubMed
-
- Pollex RL, Hegele RA. Hutchinson–Gilford progeria syndrome. Clin Genet. 2004;66:375–381. - PubMed
-
- De Sandre-Giovannoli A, Bernard R, Cau P, et al. Lamin a truncation in Hutchinson–Gilford progeria. Science. 2003;300:2055. - PubMed
-
- Goldman RD, Gruenbaum Y, Moir RD, Shumaker DK, Spann TP. Nuclear lamins: building blocks of nuclear architecture. Genes Dev. 2002;16:533–547. - PubMed
Publication types
MeSH terms
Substances
LinkOut - more resources
Full Text Sources
Other Literature Sources
Miscellaneous
