

Centrotemporal sharp wave EEG trait in rolandic epilepsy maps to Elongator Protein Complex 4 (ELP4)
- PMID: 19172991
- PMCID: PMC2729813
- DOI: 10.1038/ejhg.2008.267
Centrotemporal sharp wave EEG trait in rolandic epilepsy maps to Elongator Protein Complex 4 (ELP4)
Abstract
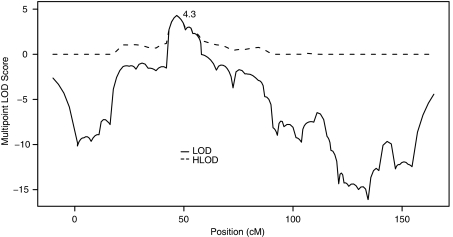
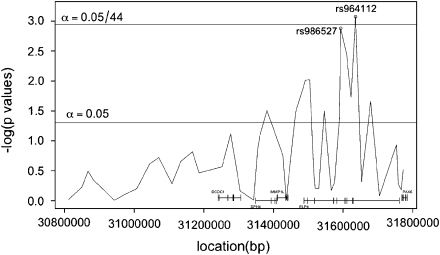
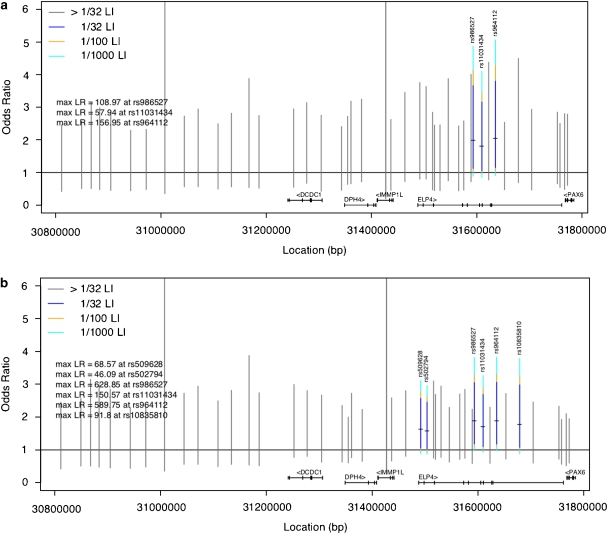
Rolandic epilepsy (RE) is the most common human epilepsy, affecting children between 3 and 12 years of age, boys more often than girls (3:2). Focal sharp waves in the centrotemporal area define the electroencephalographic (EEG) trait for the syndrome, are a feature of several related childhood epilepsies and are frequently observed in common developmental disorders (eg, speech dyspraxia, attention deficit hyperactivity disorder and developmental coordination disorder). Here we report the first genome-wide linkage scan in RE for the EEG trait, centrotemporal sharp waves (CTS), with genome-wide linkage of CTS to 11p13 (HLOD 4.30). Pure likelihood statistical analysis refined our linkage peak by fine mapping CTS to variants in Elongator Protein Complex 4 (ELP4) in two independent data sets; the strongest evidence was with rs986527 in intron 9 of ELP4, providing a likelihood ratio of 629:1 (P=0.0002) in favor of an association. Resequencing of ELP4 coding, flanking and promoter regions revealed no significant exonic polymorphisms. This is the first report of a gene implicated in a common focal epilepsy and the first human disease association of ELP4. ELP4 is a component of the Elongator complex, involved in transcription and tRNA modification. Elongator depletion results in the brain-specific downregulation of genes implicated in cell motility and migration. We hypothesize that a non-coding mutation in ELP4 impairs brain-specific Elongator-mediated interaction of genes implicated in brain development, resulting in susceptibility to seizures and neurodevelopmental disorders.
Figures
References
-
- Shinnar S, O'Dell C, Berg AT. Distribution of epilepsy syndromes in a cohort of children prospectively monitored from the time of their first unprovoked seizure. Epilepsia. 1999;40:1378–1383. - PubMed
-
- Beaussart M. Benign epilepsy of children with Rolandic (centro-temporal) paroxysmal foci: a clinical entity. Study of 221 cases. Epilepsia. 1972;13:795–811. - PubMed
-
- Kavros PM, Clarke T, Strug LJ, Halperin JM, Dorta NJ, Pal DK. Attention impairment in rolandic epilepsy: systematic review. Epilepsia. 2008;49:1570–1580. - PubMed
Publication types
MeSH terms
Substances
Grants and funding
LinkOut - more resources
Full Text Sources
Other Literature Sources
Molecular Biology Databases
Research Materials
