Review
. 2009 May 1;107(1):11-8.
doi: 10.1002/jcb.22077.

Genomic location analysis by ChIP-Seq

Affiliations
Review

Genomic location analysis by ChIP-Seq

Artem Barski et al. J Cell Biochem. .

Abstract

The interaction of a multitude of transcription factors and other chromatin proteins with the genome can influence gene expression and subsequently cell differentiation and function. Thus systematic identification of binding targets of transcription factors is key to unraveling gene regulation networks. The recent development of ChIP-Seq has revolutionized mapping of DNA-protein interactions. Now protein binding can be mapped in a truly genome-wide manner with extremely high resolution. This review discusses ChIP-Seq technology, its possible pitfalls, data analysis and several early applications.


Figures
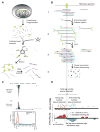
Figure 1
Figure 1
A. Chromatin immunoprecipitation. 1. DNA is bound by a protein of interest in the nucleus. 2. Cells are lysed and DNA is fragmented. 3. Fragments bound by protein of interest (purple) are bound by antibody bead complexes and precipitated. Some DNA fragments can be precipitated nonspecifically(gray). 4. Protein-DNA complexes are eluted and DNA is purified. Relative abundance of specific and non-specific fragments is analyzed by qPCR B. ChIP-Seq library construction. 1. Specific (colored) non-specific(gray) immunoprecipitated fragments are shown mapped to genome.2. DNA termini are polished, phosphorylated, A is added and adapters are ligated. 3. Library is PCR amplified. 4. DNA fragments are hybridized to flowcell, clusters are synthesized and sequenced. C. Typical view of ChIP-Seq results. Results of H3K4me3 ChIP-Seq in CD4+ T cells [Barski et al., 2007a] in the vicinity of CD4 gene are shown. Top track: Individual tags. Bottom track: Summary view- bars show number of tags in 200 bp windows. Graph below shows average H3K4me3 tag density profile in the gene body (TSS) for expressed and silent genes. D. SISSRs algorithm. Net tag count is calculated as a number of sense strand tags minus number of antisense tags in small windows. The point where net tag count crosses 0 with a negative derivative is considered a binding site if sense, antisense and total total tag numbers for the site are above certain threshold. See [Jothi et al., 2008] for details.

References

    1. Albert I, Wachi S, Jiang C, Pugh BF. GeneTrack--a genomic data processing and visualization framework. Bioinformatics. 2008;24:1305–6. - PMC - PubMed
    1. Barski A, Cuddapah S, Cui K, Roh TY, Schones DE, Wang Z, Wei G, Chepelev I, Zhao K. High-resolution profiling of histone methylations in the human genome. Cell. 2007a;129:823–37. - PubMed
    1. Barski A, Cuddapah S, Cui K, Roh TY, Schones DE, Wang Z, Wei G, Chepelev I, Zhao K. Response: Mapping Nucleosome Positions Using ChIP-Seq Data. Cell. 2007b;131:832–33.
    1. Barski A, Frenkel B. ChIP Display: novel method for identification of genomic targets of transcription factors. Nucleic Acids Res. 2004;32:e104. - PMC - PubMed
    1. Bernstein BE, Meissner A, Lander ES. The mammalian epigenome. Cell. 2007;128:669–81. - PubMed

Publication types

MeSH terms

Substances

LinkOut - more resources