. 2009 Jan 27:10:53.
doi: 10.1186/1471-2164-10-53.

Combinatorial effects of environmental parameters on transcriptional regulation in Saccharomyces cerevisiae: a quantitative analysis of a compendium of chemostat-based transcriptome data

Affiliations

Combinatorial effects of environmental parameters on transcriptional regulation in Saccharomyces cerevisiae: a quantitative analysis of a compendium of chemostat-based transcriptome data

Theo A Knijnenburg et al. BMC Genomics. .

Abstract

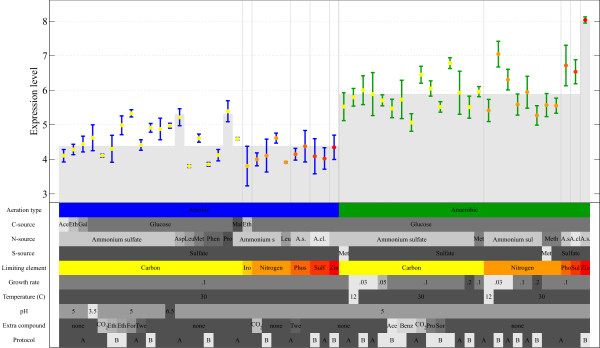
Background: Microorganisms adapt their transcriptome by integrating multiple chemical and physical signals from their environment. Shake-flask cultivation does not allow precise manipulation of individual culture parameters and therefore precludes a quantitative analysis of the (combinatorial) influence of these parameters on transcriptional regulation. Steady-state chemostat cultures, which do enable accurate control, measurement and manipulation of individual cultivation parameters (e.g. specific growth rate, temperature, identity of the growth-limiting nutrient) appear to provide a promising experimental platform for such a combinatorial analysis.

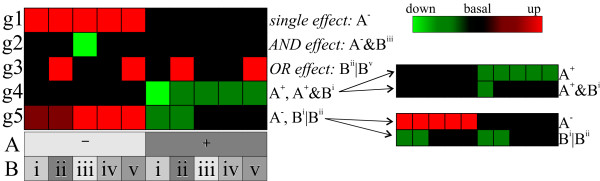
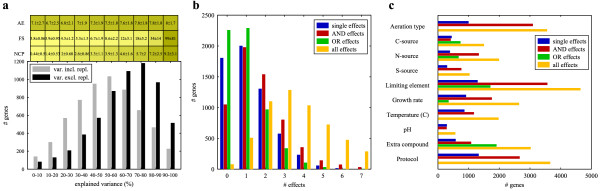
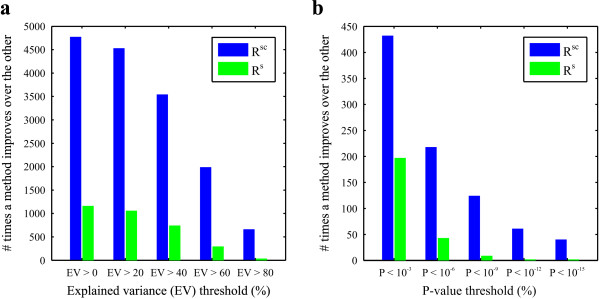
Results: A microarray compendium of 170 steady-state chemostat cultures of the yeast Saccharomyces cerevisiae is presented and analyzed. The 170 microarrays encompass 55 unique conditions, which can be characterized by the combined settings of 10 different cultivation parameters. By applying a regression model to assess the impact of (combinations of) cultivation parameters on the transcriptome, most S. cerevisiae genes were shown to be influenced by multiple cultivation parameters, and in many cases by combinatorial effects of cultivation parameters. The inclusion of these combinatorial effects in the regression model led to higher explained variance of the gene expression patterns and resulted in higher function enrichment in subsequent analysis. We further demonstrate the usefulness of the compendium and regression analysis for interpretation of shake-flask-based transcriptome studies and for guiding functional analysis of (uncharacterized) genes and pathways.

Conclusion: Modeling the combinatorial effects of environmental parameters on the transcriptome is crucial for understanding transcriptional regulation. Chemostat cultivation offers a powerful tool for such an approach.


Figures

Figure 1
Figure 1
Expression levels of UPC2 across the 55 cultivation conditions. The colored matrix is a schematic representation of the settings of the ten cultivation parameters over the 55 conditions. The colored lanes indicate the cultivation parameters that are employed to order the experiments, in this case, aeration type and limiting element. The applied regression model was able to explain 71% of the variance in the expression of this gene. The model selected one significant single effect, i.e. aeration type, and two significant combinatorial effects, i.e. aeration type anaerobic together with limiting element zinc and the usage of proline or asparagine as nitrogen source. The reconstructed expression pattern based on these three effects is indicated by the shaded area.
Figure 2
Figure 2
Schematic representation of the normalized expression patterns of genes affected by a single effect, combinatorial effect or a mixture of these. In this example there are two cultivation parameters, A and B, which can assume two and five different values, respectively. Genes g1, g2 and g3 are affected by a single effect, AND effect and OR effect, respectively. The expression of genes g4 and g5 is constituted by the influence of both a single effect and a combinatorial effect.
Figure 3
Figure 3
General statistics of the applied regression model. a: Histogram plot indicating how much variance within the gene expression patterns could be explained by the regression model for all (differentially expressed) genes. The black bars indicate the percentage of explained variance when excluding the variance present in the replicates, and which, therefore, cannot be explained by the regression model. Above the histogram are the mean and variance of the average expression level (AE), the F-statistic (FS) and the number of selected cultivation parameters (NCP) for the groups of genes with explained variance (including replicate variance) as stated on the x-axis of the histogram. b: Histogram plot indicating the number of single and combinatorial effects as well as the total number of effects that were selected to explain the observed gene expression patterns. c: Histogram plot indicating the number of genes influenced by particular cultivation parameters, either as a single effect, AND effect, OR effect or independent of the effect type ('all effects'). The 'all effects' bar is not the sum of the other three, because genes can be affected by a cultivation parameter both as a single effect and as a combinatorial effect.
Figure 4
Figure 4
Comparison between the regression analysis including including both the single and the combinatorial effects (Rsc) and the regression analysis including only the single effects (Rs). a: Histogram plot indicating how many times one method (Rsc or Rs) leads to a higher percentage of explained variance (EV) of a gene given that the EV of this gene is larger than the EV threshold (x-axis) for at least one of both methods. b: Histogram plot indicating how many times one method (Rsc or Rs) leads to a higher enrichment value (lower p-value) for a functional category given that the enrichment of this category is below a p-value threshold (x-axis) for at least one of both methods.
Figure 5
Figure 5
The influence of the protocol on gene expression. All genes that are affected by the modifications to the protocol, either as a single effect or as an interaction effect, are analyzed. First, the mean expression levels of these genes across all 55 conditions are computed. The genes are divived in seven groups based on their mean expression levels such that each group holds the same amount (i.e. 14,3%) of the genes. Each group is characterized by a lower and a higher bound on the expression value; these two numbers represent the range of the mean expression levels of the genes within the group. Also, we dichotomize the genes into the ones with positive regression weights (i.e. upregulation under Protocol B with respect to Protocol A) and the ones with negative regression weights. a: The blue bars indicate the percentage of genes with positive regression weights (higher under Protocol B) across these groups (or expression ranges). Similarly, the red bars indicate these percentages for the genes with negative coefficients (higher under Protocol A). b, c: For the same ranges, each bar represents the percentage of genes in the range annotated to a particular functional category over all of the genes that are annotated with this category and affected by the protocol.
Figure 6
Figure 6
Superpathway of sulfur amino acid biosynthesis. Near each enzyme (gene product) is a bar representing the regression weights of the six significant cultivation parameters. These parameters are stated in the legend in the upper-left corner of this figure. A blank box indicates that the cultivation parameter is not selected by the regression model. Red and green boxes indicate positive (upregulation) and negative (downregulation) regression weights, respectively. Darker colors indicate larger regression weights.
Figure 7
Figure 7
Normalized gene expression patterns of the genes that are part of the superpathway of sulfur amino acid biosynthesis and additional genes discussed in the text. The expression values of each gene are linearly scaled to range from -1 to 1. Here, -1 represents the lowest expression value and 1 indicates a gene's highest expression value. These normalized expression patterns are projected on the green-black-red colormap to derive the heatmap visualization. Separate branches of the pathway are indicated by the grey horizontal lines. For the group denoted as "Additional genes", the grey horizontal lines split the genes in functionally related groups. The magenta boxes and arrows indicate the cultivation parameters, where methionine is used as nitrogen or sulfur source. The magenta ellipses and arrows highlight the expression levels of the SOD and GSH genes under zinc limitation.
Figure 8
Figure 8
Normalized gene expression patterns for twelve uncharacterized or dubious genes. The expression values of each gene are linearly scaled to range from -1 to 1. Here, -1 represents the lowest expression value and 1 indicates a gene's highest expression value. These normalized expression patterns are projected on the green-black-red colormap to derive the heatmap visualization. The magenta boxes and lines highlight the cultivation parameters that influence the expression of the genes.
Figure 9
Figure 9
Analysis of two groups: The genes upregulated in a dig1Δ, dig2Δ strain and the genes downregulated in this strain. Middle: Normalized regression weights for the significant cultivation parameters across the gene groups. Top: The genes were clustered based on these regression weights. Bottom: Schematic representation of the enrichment p-values and related false discovery rates (q-values) for each of the uncovered clusters when related to TF binding data and MIPS functional categories.

Similar articles

Cited by

References

    1. Bar-Joseph Z, Gerber GK, Lee TI, Rinaldi NJ, Yoo JY, Robert F, Gordon DB, Fraenkel E, Jaakkola TS, Young RA, Gifford DK. Computational discovery of gene modules and regulatory networks. Nat Biotechnol. 2003;21:1337–1342. doi: 10.1038/nbt890. - DOI - PubMed
    1. Luscombe NM, Babu MM, Yu H, Snyder M, Teichmann SA, Gerstein M. Genomic analysis of regulatory network dynamics reveals large topological changes. Nature. 2004;431:308–312. doi: 10.1038/nature02782. - DOI - PubMed
    1. Tan PK, Downey TJ, Spitznagel EL, Xu P, Fu D, Dimitrov DS, Lempicki RA, Raaka BM, Cam MC. Evaluation of gene expression measurements from commercial microarray platforms. Nucleic Acids Res. 2003;31:5676–5684. doi: 10.1093/nar/gkg763. - DOI - PMC - PubMed
    1. Bammler T, Beyer RP, Bhattacharya S, Boorman GA, Boyles A, Bradford BU, Bumgarner RE, Bushel PR, Chaturvedi K, Choi D, Cunningham ML, Deng S, Dressman HK, Fannin RD, Farin FM, Freedman JH, Fry RC, Harper A, Humble MC, Hurban P, Kavanagh TJ, Kaufmann WK, Kerr KF, Jing L, Lapidus JA, Lasarev MR, Li J, Li YJ, Lobenhofer EK, Lu X, Malek RL, Milton S, Nagalla SR, O'malley JP, Palmer VS, Pattee P, Paules RS, Perou CM, Phillips K, Qin LX, Qiu Y, Quigley SD, Rodland M, Rusyn I, Samson LD, Schwartz DA, Shi Y, Shin JL, Sieber SO, Slifer S, Speer MC, Spencer PS, Sproles DI, Swenberg JA, Suk WA, Sullivan RC, Tian R, Tennant RW, Todd SA, Tucker CJ, Houten BV, Weis BK, Xuan S, Zarbl H, of the Toxicogenomics Research Consortium M Standardizing global gene expression analysis between laboratories and across platforms. Nat Methods. 2005;2:351–356. doi: 10.1038/nmeth754. - DOI - PubMed
    1. Tai SL, Boer VM, Daran-Lapujade P, Walsh MC, de Winde JH, Daran JM, Pronk JT. Two-dimensional transcriptome analysis in chemostat cultures. Combinatorial effects of oxygen availability and macronutrient limitation in Saccharomyces cerevisiae. J Biol Chem. 2005;280:437–447. doi: 10.1074/jbc.M501243200. - DOI - PubMed

Publication types

MeSH terms