. 2009 Feb 10;106(6):2059-64.
doi: 10.1073/pnas.0812859106. Epub 2009 Jan 27.

Functional expression of the olfactory signaling system in the kidney

Affiliations

Functional expression of the olfactory signaling system in the kidney

Jennifer L Pluznick et al. Proc Natl Acad Sci U S A. .

Abstract

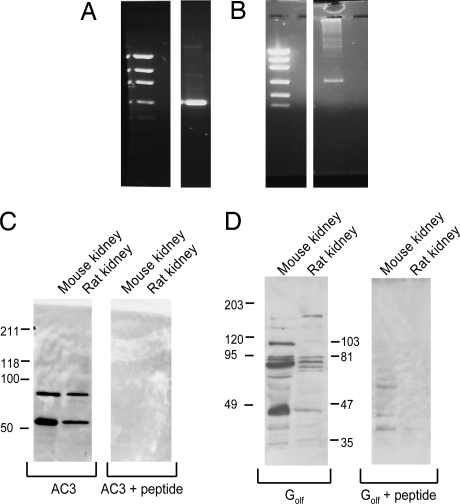
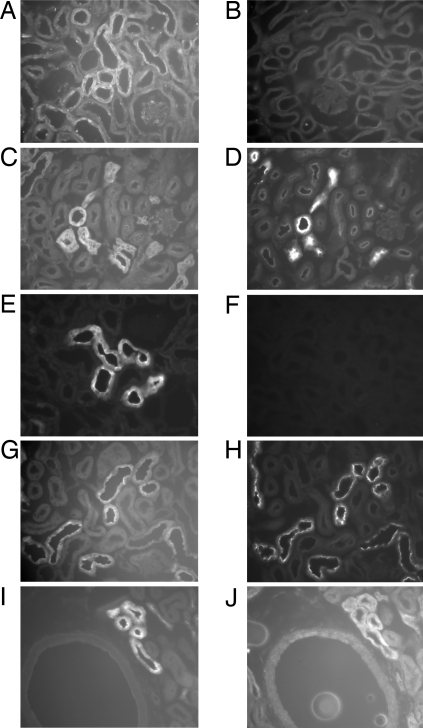
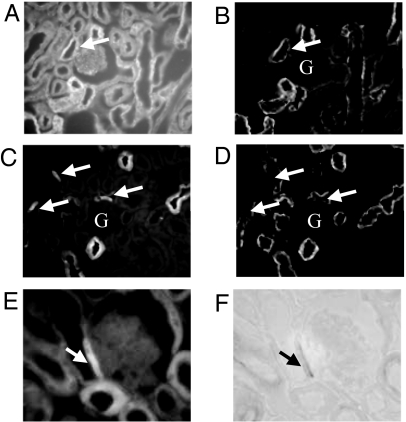
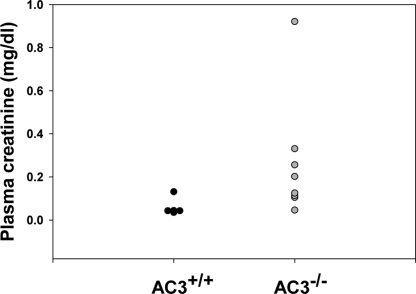
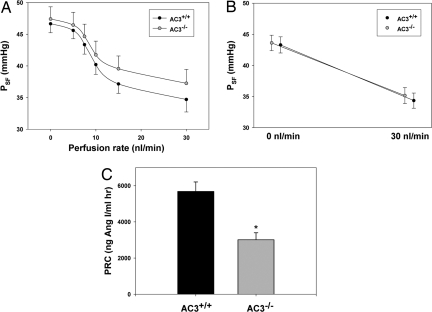
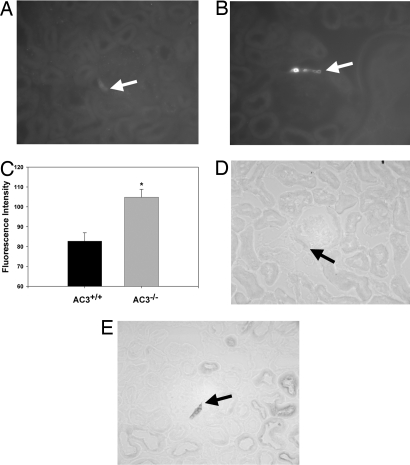
Olfactory-like chemosensory signaling occurs outside of the olfactory epithelium. We find that major components of olfaction, including olfactory receptors (ORs), olfactory-related adenylate cyclase (AC3) and the olfactory G protein (G(olf)), are expressed in the kidney. AC3 and G(olf) colocalize in renal tubules and in macula densa (MD) cells which modulate glomerular filtration rate (GFR). GFR is significantly reduced in AC3(-/-) mice, suggesting that AC3 participates in GFR regulation. Although tubuloglomerular feedback is normal in these animals, they exhibit significantly reduced plasma renin levels despite up-regulation of COX-2 expression and nNOS activity in the MD. Furthermore, at least one member of the renal repertoire of ORs is expressed in a MD cell line. Thus, key components of olfaction are expressed in the renal distal nephron and may play a sensory role in the MD to modulate both renin secretion and GFR.


Conflict of interest statement

The authors declare no conflict of interest.

Figures

Fig. 1.
Fig. 1.
Two primary components of the olfaction pathway, AC3 and Golf, are expressed in kidney. (A and B) Both AC3 (A) and Golf (B) are detected in mouse kidneys by RT-PCR. The left lane is a low DNA mass ladder (Invitrogen 10068–013). The primers used for both AC3 and Golf span introns, and products were cloned and sequenced to confirm identity. In addition, AC3 and Golf proteins were detected in both mouse and rat kidneys by Western blot. (C and D) Bands of the expected sizes were obtained for AC3 (55 kDa, 90kDa) (C) and Golf (43/46 kDa, 77 kDa) (D), and antibody binding was competitively blocked by preincubating each antibody with an excess of its antigenic peptide.
Fig. 2.
Fig. 2.
Golf and AC3 are expressed together in renal DCT. (A and B) Golf is expressed in distal tubule segments in the cortex (A), and this staining is no longer present when the antibody is preincubated with its antigenic peptide (B). (C and D) Golf expression was localized to the DCT by examining serial sections of mouse renal tissue stained for Golf (C) and for NCC, a DCT marker (D). (E and F) AC3 also localizes to cortical distal tubule segments (E); this staining is completely competitively blocked when the AC3 antibody is preincubated with its anitgenic peptide (F). Although the AC3 staining pattern appears to be distributed throughout the cytoplasm, it frequently exhibited particularly strong labeling along the apical edge of renal epithelial cells. (E) Similar to Golf, AC3 is expressed in the DCT, as demonstrated by analysis of serial sections of mouse kidneys stained with antibodies directed against AC3 (G) and NCC (H). (I and J) Furthermore, and most importantly, AC3 and Golf colocalize with one another, as shown in serial sections of mouse kidney stained with antibodies directed against AC3 (I) and Golf (J).
Fig. 3.
Fig. 3.
AC3 and Golf both localize to the cells of the MD. An antibody against the Na+-K+-ATPase was used to highlight MD cells because MD cells exhibit dramatically less Na+-K+-ATPase expression than their neighboring cells. (A and B) Golf (A) is expressed in the MD, as identified by the Na+-K+-ATPase staining pattern (B, arrows indicate MD). However, Golf is also well-expressed in the surrounding cells of the DCT. (C and D) In contrast, AC3 is strongly and specifically expressed in MD cells (C), which are once again identified by their relative lack of Na+-K+-ATPase staining and their position directly opposite the vascular pole of a glomerulus (D). (E and F) AC3 also colocalizes to the MD (E) as identified by NADPH diaphorase staining (F). Glomeruli are labeled by “G” in B–D.
Fig. 4.
Fig. 4.
AC3−/− mice tend to manifest increased plasma creatinine levels as compared with their wild-type littermates. Although AC3+/+ mice (n = 5) all exhibit appropriately low plasma creatinine values, AC3−/− mice (n = 8) manifest a wide range of plasma creatinine values, extending from near normal to quite elevated. This range of values is consistent with the ≈40% reduction in inulin clearance detected in these animals, because plasma creatinine values only begin to rise once GFR is reduced by 50% or more.
Fig. 5.
Fig. 5.
Although tubuloglomerular feedback (TGF) is normal, plasma renin concentration is significantly reduced in AC3−/− mice. TGF was measured by single nephron micropuncture. Distal flow rates were varied in individual nephrons and the stop flow technique was used to assess consequent changes in stop-flow pressures. (A) The traces presented demonstrate that over a range of distal flow rates, AC3−/− mice (n = 10) are able to properly regulate proximal stop-flow pressure in a manner similar to that of wild-type littermates (n = 10). (B) Similarly, (with a larger n) there is no difference in the proximal stop-flow rates between AC3+/+ (n = 20) and AC3−/− mice (n = 25) at the minimal and maximal distal flow rates investigated. (C) Although TGF is normal, plasma renin is significantly reduced in AC3−/− mice. The plasma renin concentrations in AC3−/− mice (n = 11) are reduced by nearly 50% as compared with their wild-type littermates (n = 9; * indicates P < 0.001).
Fig. 6.
Fig. 6.
COX-2 expression and nNOS activity are up-regulated in the MD of AC3−/−. (A–C) COX-2 staining in AC3−/− (B) is significantly greater than in wild-type littermates (A), as quantified in C. (D and E) nNOS activity, as indicated by NADPH-diaphorase staining, also appeared to be increased in AC3−/− (D) as compared with AC3+/+ (E). Arrows indicate MD.

Similar articles

Cited by

References

    1. Buck L, Axel R. A novel multigene family may encode odorant receptors: A molecular basis for odor recognition. Cell. 1991;65:175–187. - PubMed
    1. Wong ST, et al. Disruption of the type III adenylyl cyclase gene leads to peripheral and behavioral anosmia in transgenic mice. Neuron. 2000;27:487–497. - PubMed
    1. Belluscio L, Gold GH, Nemes A, Axel R. Mice deficient in G(olf) are anosmic. Neuron. 1998;20:69–81. - PubMed
    1. Spehr M, et al. Identification of a testicular odorant receptor mediating human sperm chemotaxis. Science. 2003;299:2054–2058. - PubMed
    1. Livera G, et al. Inactivation of the mouse adenylyl cyclase 3 gene disrupts male fertility and spermatozoon function. Mol Endocrinol. 2005;19:1277–1290. - PubMed

Publication types