. 2009 Mar 7;54(5):1089-109.
doi: 10.1088/0031-9155/54/5/001. Epub 2009 Jan 27.

pH-induced contrast in viscoelasticity imaging of biopolymers

Affiliations

pH-induced contrast in viscoelasticity imaging of biopolymers

R D Yapp et al. Phys Med Biol. .

Abstract

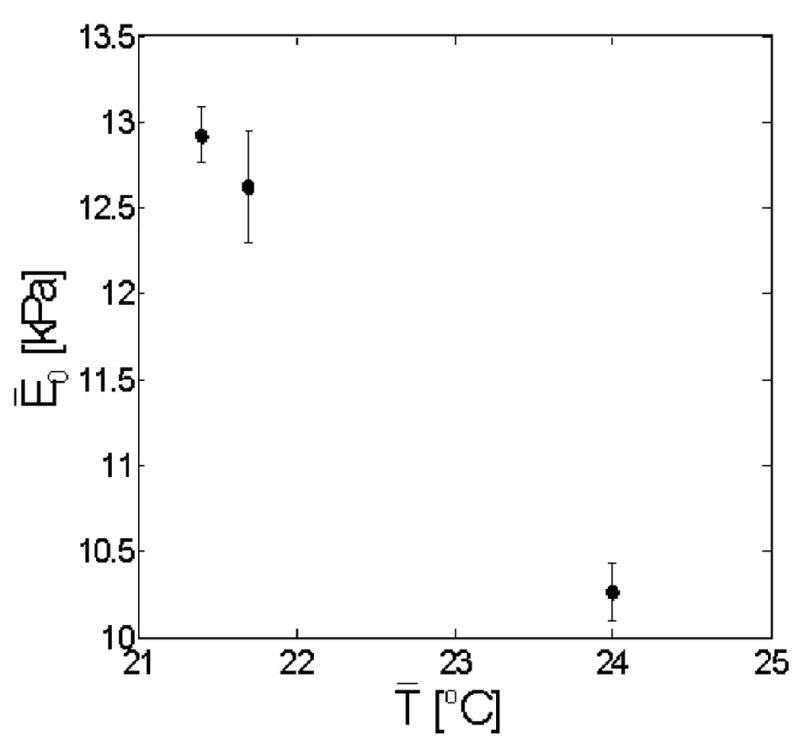
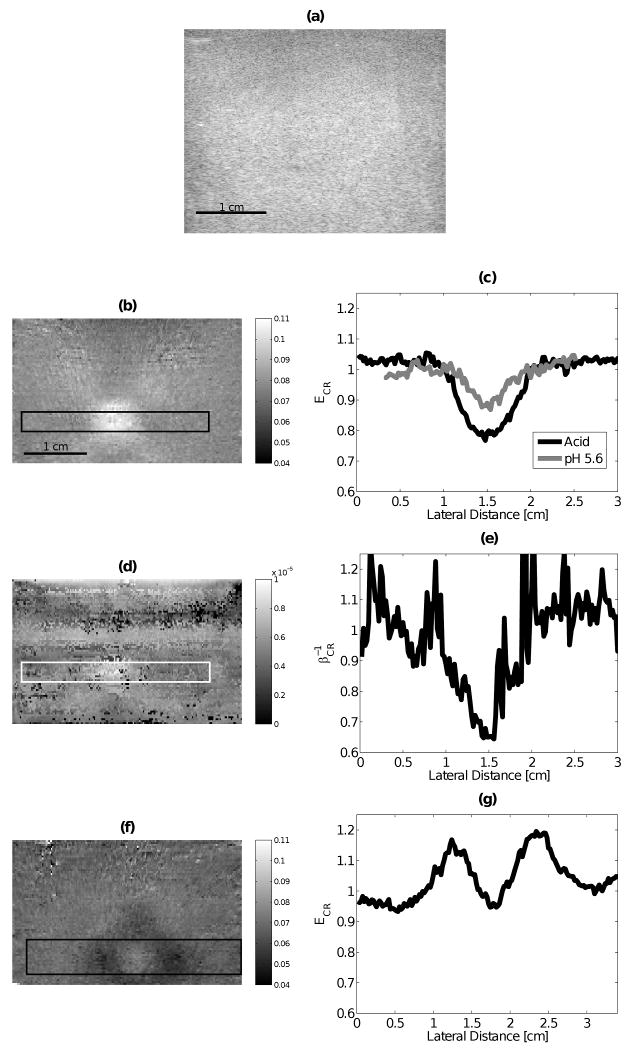
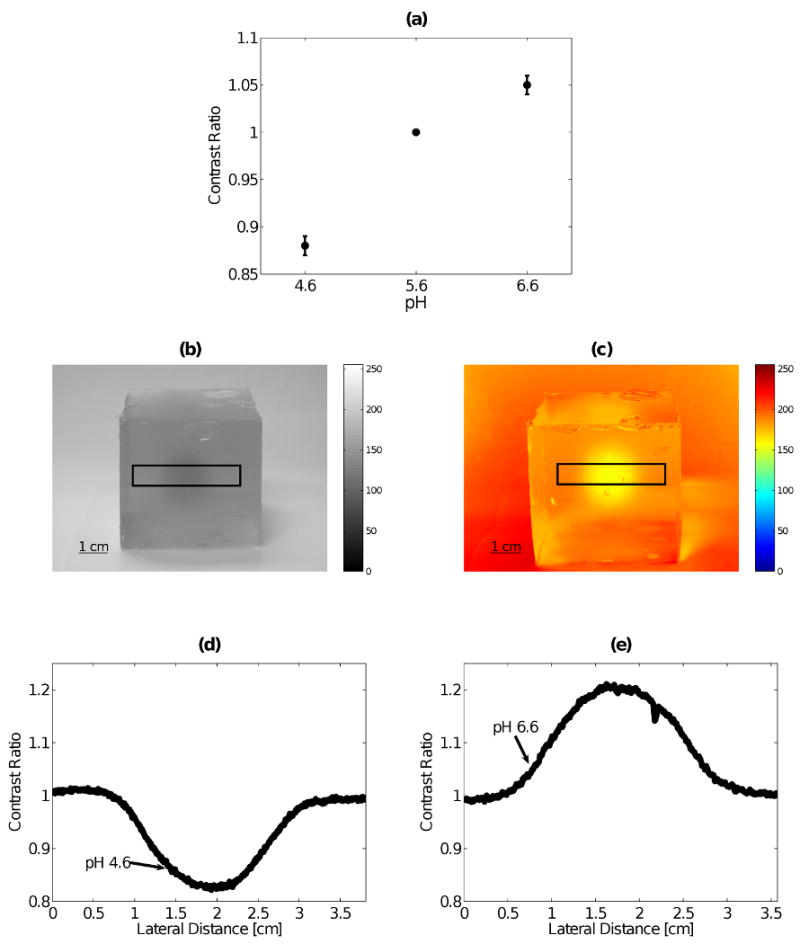
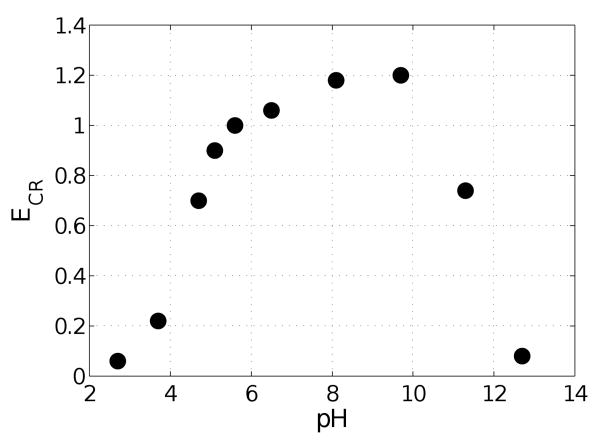
Understanding contrast mechanisms and identifying discriminating features is at the heart of diagnostic imaging development. This paper focuses on how pH influences the viscoelastic properties of biopolymers to better understand the effects of extracellular pH on breast tumour elasticity imaging. Extracellular pH is known to decrease as much as 1 pH unit in breast tumours, thus creating a dangerous environment that increases cellular mutation rates and therapeutic resistance. We used a gelatin hydrogel phantom to isolate the effects of pH on a polymer network with similarities to the extracellular matrix in breast stroma. Using compressive unconfined creep and stress relaxation measurements, we systematically measured the viscoelastic features sensitive to pH by way of time-domain models and complex modulus analysis. These results are used to determine the sensitivity of quasi-static ultrasonic elasticity imaging to pH. We found a strong elastic response of the polymer network to pH, such that the matrix stiffness decreases as pH was reduced; however, the viscous response of the medium to pH was negligible. While physiological features of breast stroma such as proteoglycans and vascular networks are not included in our hydrogel model, observations in this study provide insight into viscoelastic features specific to pH changes in the collagenous stromal network. These observations suggest that the large contrast common in breast tumours with desmoplasia may be reduced under acidic conditions, and that viscoelastic features are unlikely to improve discriminability.


Figures

Figure 1
Figure 1
This figure displays schematics of the three experimental methods. (a) illustrates unconfined uniaxial compression (when the stimulus is stress this is a creep experiment, and when the stimulus is strain this is a stress relaxation experiment). (b) illustrates the elasticity imaging experiment.
Figure 2
Figure 2
The stress versus time plot (a) of the stress-strain preconditioning on an IEP gel (pH 5.6) for 40 cycles. Figure (b) displays cycle 40 of the stress-strain data used to estimate E0.
Figure 3
Figure 3
The experimental setup for elasticity imaging measurements described in section 3.5. The components are:(a) the digital scale, (b) the gelatin phantom, (c) the ultrasound transducer, (d) the motion controller, and (e) the ultrasound system.
Figure 4
Figure 4
(a): Strain data for representative creep experiments on gel samples at pH 4.6, 5.6, and 6.6. (b) row 1 provides the strain amplitude parameters and β for a tri-exponential Voigt model. (b) row 2 provides the VE time constants of the model. Results of two gel samples are displayed for each pH level with • corresponding to sample 1 and × corresponding to sample 2.
Figure 5
Figure 5
Stress data for representative stress relaxation experiments on gel samples at pH 4.6, 5.6, and 6.6.
Figure 6
Figure 6
(a) displays ECR values for Ē0 values for stress-strain preconditioning (×), creep (◇), and stress relaxation (•) measurements. The error bars on × data correspond to the SD/Ē0 values displayed in table 2. (b) displays βCR1 calculated from average β estimates from creep measurements.
Figure 7
Figure 7
(a) and (b) display the storage E′(ω) and loss E″(ω) modulus spectra, respectively, for gelatin gels of pH 4.6, 5.6, and 6.6 as found from creep measurements. (c) and (d) display the same spectra as found from stress relaxation measurements.
Figure 8
Figure 8
Variability in average elastic modulus Ē0 with average storage temperature . Ē0 values were determined from the 40th cycle of stress-strain preconditioning. The associated error bar is ±1 sample standard deviation.
Figure 9
Figure 9
(a) is a representative ultrasonic B-mode image of an injection phantom. (b) is the ε0 image of the acid injection phantom and (c) displays the corresponding ECR profile relative to the background along with the ECR profile for the control pH 5.6 injection (ε0 image not shown). (d) is the β image of the acid injection phantom and (e) displays the corresponding βCR1 profile. (f) is the ε0 image of the base injection phantom and (g) displays the corresponding ECR profile. Rectangular regions in the images show the areas from which the profile plots to the right were obtained.
Figure 10
Figure 10
(a) displays the contrast ratios for individual pH values based upon the pH indicator solution contrast in gel samples. (b) displays the grey scale image of the acid injection phantom with pH indicator solution and (d) is the corresponding contrast ratio profile. (c) displays the red image of the base injection phantom with pH indicator solution and (e) is the corresponding contrast ratio profile.
Figure 11
Figure 11
Approximate ECR values vs pH from the original data of Cumper and Alexander (1952). The data presented in this figure is a modified version of that originally published by AJSR. The data value at pH 5.6 was not provided by Cumper and Alexander we interpolated this value from the 2 data points surrounding pH 5.6. Permission to reproduce this modified version of the data was granted by CSIRO Publishing. The full text of Cumper and Alexander's article can be accessed via either subscription or pay-per-view services at http://www.publish/csiro.au/nid/52/issue/3400.htm.

References

    1. Bhattacharjee A, Bansal M. IUBMB Life. 2005;57:161–172. - PubMed
    1. Brown WH. Introduction to Organic Chemistry, Second Edition. John Wiley and Sons, Inc.; New Jersey: 2002.
    1. Buehler MJ, Wong SY. Biophysical Journal. 2007;93:37–43. - PMC - PubMed
    1. Chaturvedi P, Insana M, Hall T. IEEE Transactions on Ultrasonics, Ferrorelectrics, and Frequency Control. 1998;45:1022–1031. - PubMed
    1. Cumper CWN, Alexander AE. Australian Journal of Scientific Research Series A: Physical Sciences. 1952;5:153–159.

Publication types