

Image artifacts in digital breast tomosynthesis: investigation of the effects of system geometry and reconstruction parameters using a linear system approach
- PMID: 19175083
- PMCID: PMC2673612
- DOI: 10.1118/1.2996110
Image artifacts in digital breast tomosynthesis: investigation of the effects of system geometry and reconstruction parameters using a linear system approach
Abstract
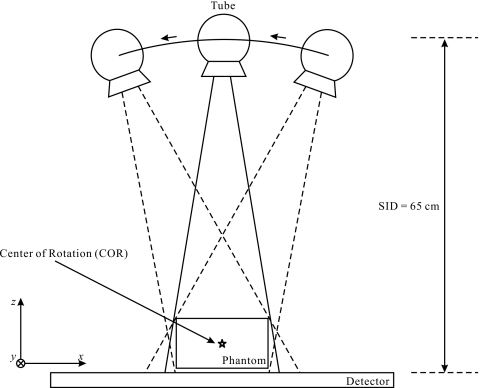
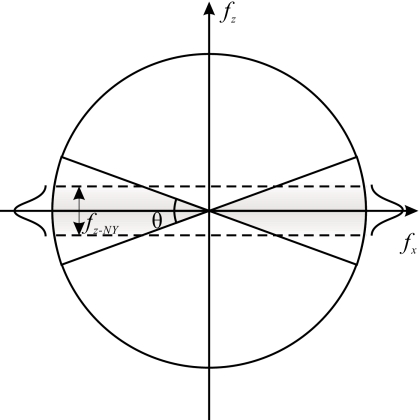
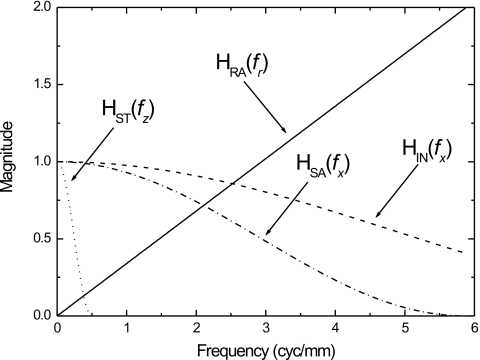
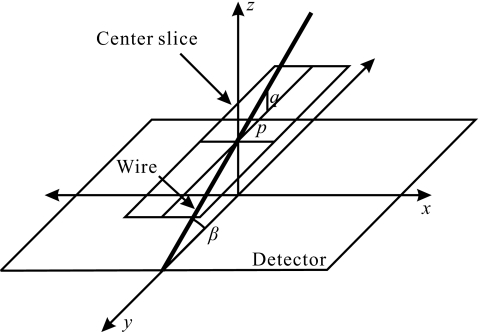
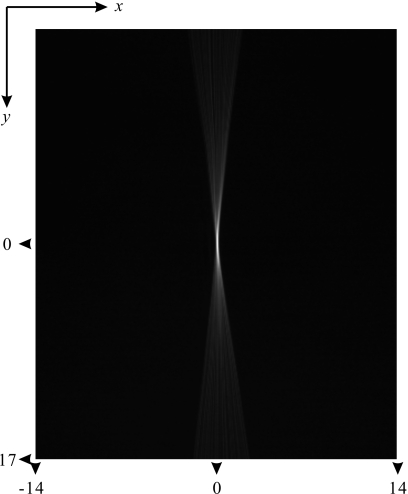
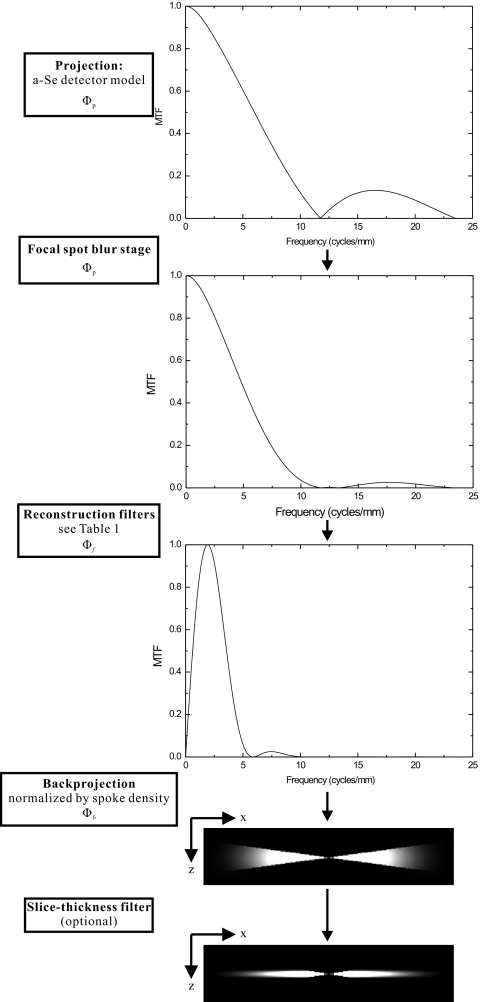
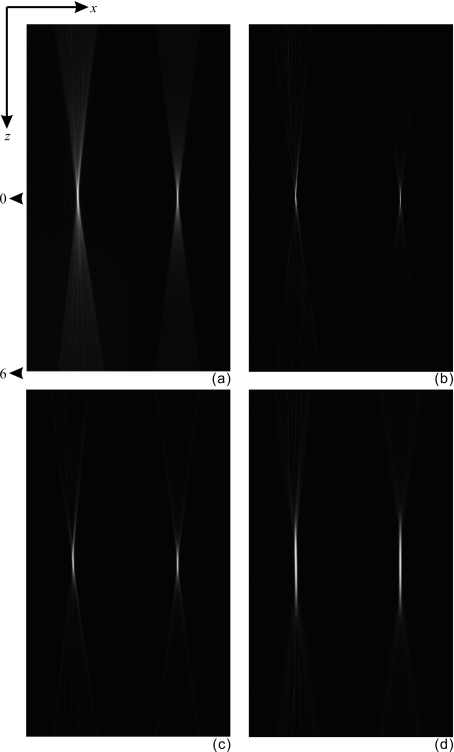
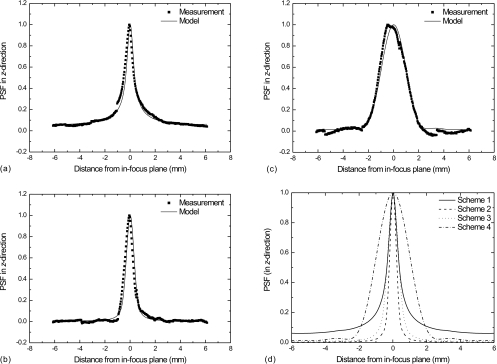
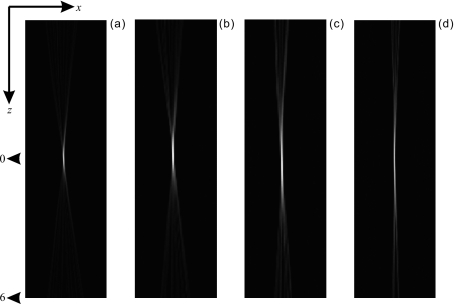
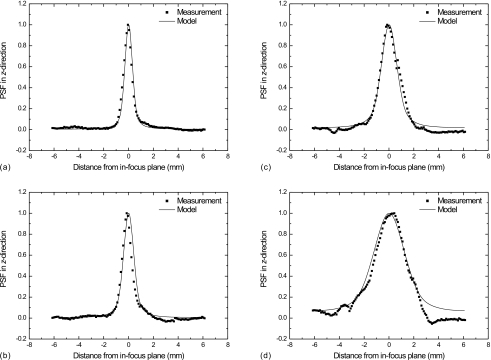
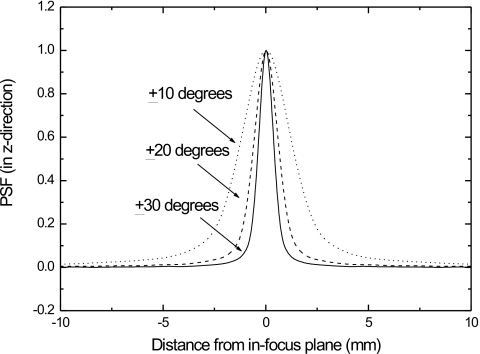
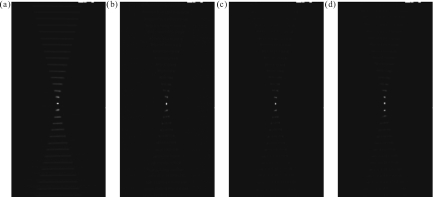
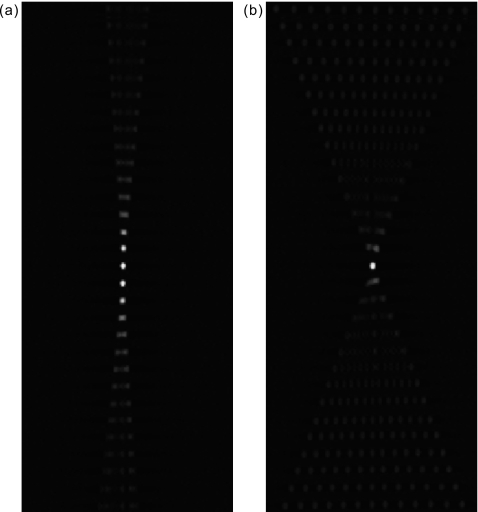
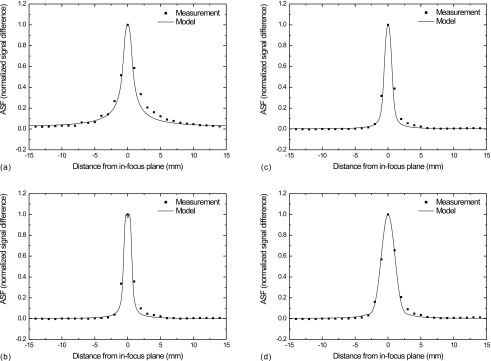
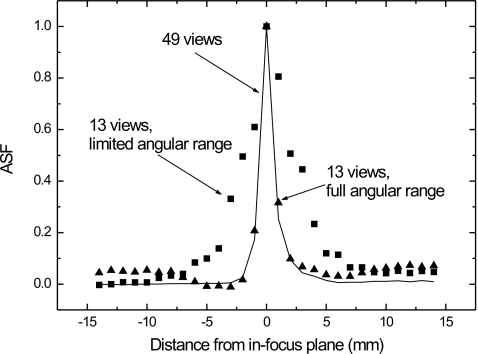
Digital breast tomosynthesis (DBT) is a three-dimensional (3D) x-ray imaging modality that reconstructs image slices parallel to the detector plane. Image acquisition is performed using a limited angular range (less than 50 degrees) and a limited number of projection views (less than 50 views). Due to incomplete data sampling, image artifacts are unavoidable in DBT. In this preliminary study, the image artifacts in DBT were investigated systematically using a linear system approximation. A cascaded linear system model of DBT was developed to calculate the 3D presampling modulation transfer function (MTF) with different image acquisition geometries and reconstruction filters using a filtered backprojection (FBP) algorithm. A thin, slanted tungsten (W) wire was used to measure the presampling MTF of the DBT system in the cross-sectional plane defined by the thickness (z-) and tube travel (x-) directions. The measurement was in excellent agreement with the calculation using the model. A small steel bead was used to calculate the artifact spread function (ASF) of the DBT system. The ASF was correlated with the convolution of the two-dimensional (2D) point spread function (PSF) of the system and the object function of the bead. The results showed that the cascaded linear system model can be used to predict the magnitude of image artifacts of small, high-contrast objects with different image acquisition geometry and reconstruction filters.
Figures
Similar articles
-
Three-dimensional linear system analysis for breast tomosynthesis.Med Phys. 2008 Dec;35(12):5219-32. doi: 10.1118/1.2996014. Med Phys. 2008. PMID: 19175081 Free PMC article.
-
Image quality of microcalcifications in digital breast tomosynthesis: effects of projection-view distributions.Med Phys. 2011 Oct;38(10):5703-12. doi: 10.1118/1.3637492. Med Phys. 2011. PMID: 21992385 Free PMC article.
-
Optimization of the acquisition geometry in digital tomosynthesis of the breast.Med Phys. 2009 Apr;36(4):1199-207. doi: 10.1118/1.3090889. Med Phys. 2009. PMID: 19472626
-
Digital breast tomosynthesis: Image acquisition principles and artifacts.Clin Imaging. 2019 May-Jun;55:188-195. doi: 10.1016/j.clinimag.2018.07.013. Epub 2018 Sep 13. Clin Imaging. 2019. PMID: 30236642 Review.
-
Evaluation of back projection methods for breast tomosynthesis image reconstruction.J Digit Imaging. 2015 Jun;28(3):338-45. doi: 10.1007/s10278-014-9736-6. J Digit Imaging. 2015. PMID: 25384538 Free PMC article. Review.
Cited by
-
Visual adaptation to medical images: a comparison of digital mammography and tomosynthesis.J Med Imaging (Bellingham). 2023 Feb;10(Suppl 1):S11909. doi: 10.1117/1.JMI.10.S1.S11909. Epub 2023 Apr 25. J Med Imaging (Bellingham). 2023. PMID: 37114188 Free PMC article.
-
Impact of Tomosynthesis Acquisition on 3D Segmentations of Breast Outline and Adipose/Dense Tissue with AI: A Simulation-Based Study.Tomography. 2023 Jul 3;9(4):1303-1314. doi: 10.3390/tomography9040103. Tomography. 2023. PMID: 37489471 Free PMC article.
-
The effect of amorphous selenium detector thickness on dual-energy digital breast imaging.Med Phys. 2014 Nov;41(11):111904. doi: 10.1118/1.4897244. Med Phys. 2014. PMID: 25370637 Free PMC article.
-
Digital breast tomosynthesis: studies of the effects of acquisition geometry on contrast-to-noise ratio and observer preference of low-contrast objects in breast phantom images.Phys Med Biol. 2014 Oct 7;59(19):5883-902. doi: 10.1088/0031-9155/59/19/5883. Epub 2014 Sep 11. Phys Med Biol. 2014. PMID: 25211509 Free PMC article.
-
Inter-plane artifact suppression in tomosynthesis using 3D CT image data.Biomed Eng Online. 2011 Dec 10;10:106. doi: 10.1186/1475-925X-10-106. Biomed Eng Online. 2011. PMID: 22151538 Free PMC article.
References
-
- Suryanarayanan S. et al. , “Evaluation of linear and nonlinear tomosynthetic reconstruction methods in digital mammography,” Acad. Radiol. ZZZZZZ 8, 219–224 (2001). - PubMed
-
- Suryanarayanan S. et al. , “Comparison of tomosynthesis methods used with digital mammography,” Acad. Radiol. ZZZZZZ 7, 1085–1097 (2000). - PubMed
-
- Niklason L. T. et al. , “Digital tomosynthesis in breast imaging,” Radiology RADLAX 205, 399–406 (1997). - PubMed
Publication types
MeSH terms
Grants and funding
LinkOut - more resources
Full Text Sources
Other Literature Sources
Medical
Miscellaneous
