

Development of a quantitative method for analysis of breast density based on three-dimensional breast MRI
- PMID: 19175084
- PMCID: PMC2673600
- DOI: 10.1118/1.3002306
Development of a quantitative method for analysis of breast density based on three-dimensional breast MRI
Abstract
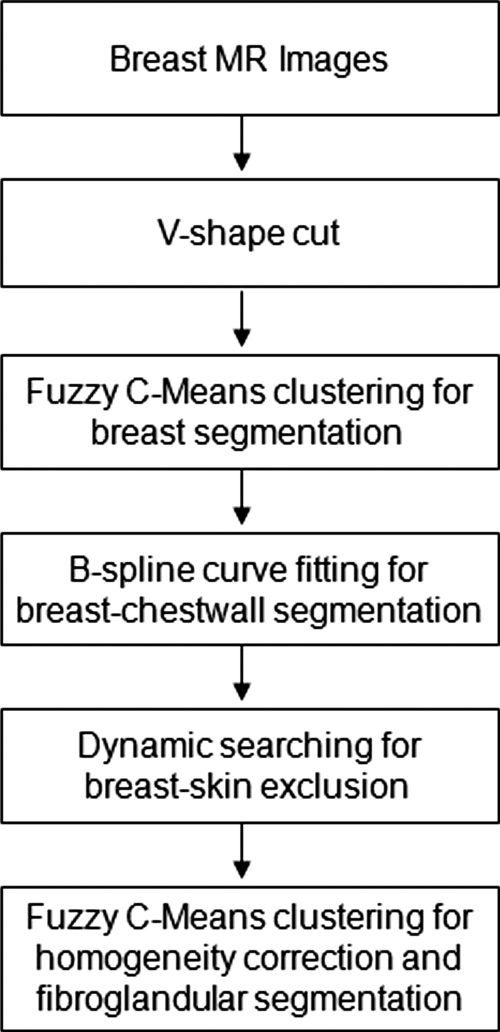
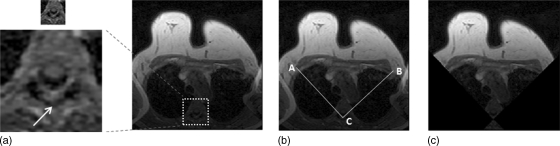
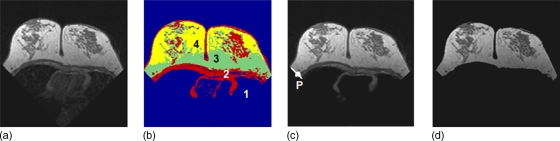
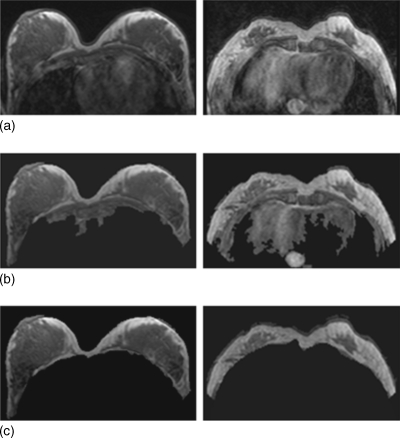
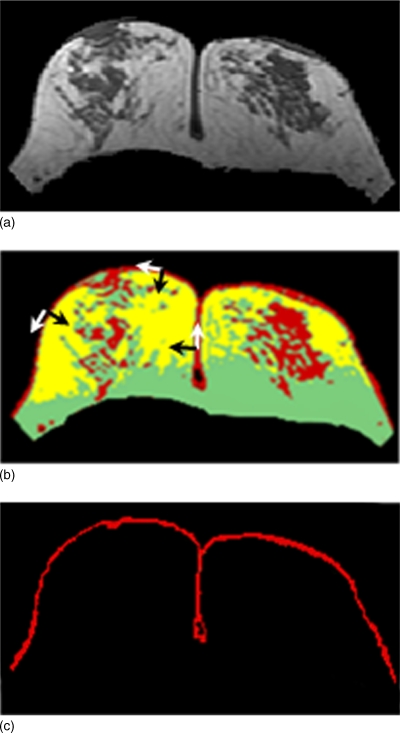
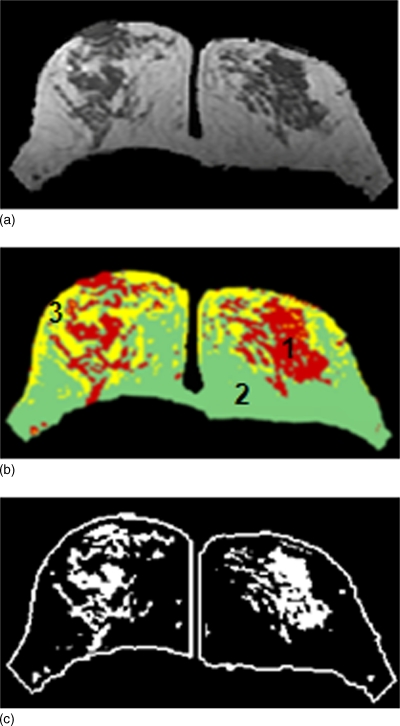
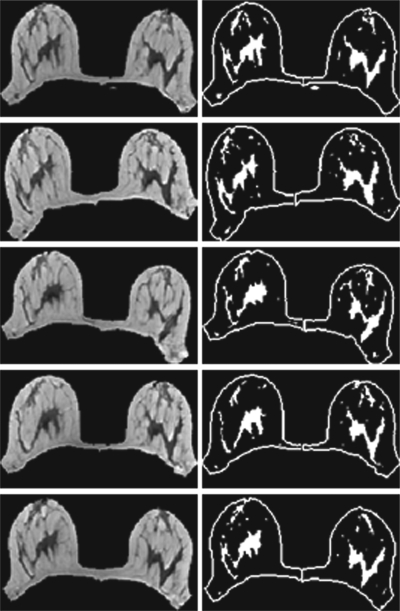
Breast density has been established as an independent risk factor associated with the development of breast cancer. It is known that an increase of mammographic density is associated with an increased cancer risk. Since a mammogram is a projection image, different body position, level of compression, and the x-ray intensity may lead to a large variability in the density measurement. Breast MRI provides strong soft tissue contrast between fibroglandular and fatty tissues, and three-dimensional coverage of the entire breast, thus making it suitable for density analysis. To develop the MRI-based method, the first task is to achieve consistency in segmentation of the breast region from the body. The method included an initial segmentation based on body landmarks of each individual woman, followed by fuzzy C-mean (FCM) classification to exclude air and lung tissue, B-spline curve fitting to exclude chest wall muscle, and dynamic searching to exclude skin. Then, within the segmented breast, the adaptive FCM was used for simultaneous bias field correction and fibroglandular tissue segmentation. The intraoperator and interoperator reproducibility was evaluated using 11 selected cases covering a broad spectrum of breast densities with different parenchymal patterns. The average standard deviation for breast volume and percent density measurements was in the range of 3%-4% among three trials of one operator or among three different operators. The body position dependence was also investigated by performing scans of two healthy volunteers, each at five different positions, and found the variation in the range of 3%-4%. These initial results suggest that the technique based on three-dimensional MRI can achieve reasonable consistency to be applied in longitudinal follow-up studies to detect small changes. It may also provide a reliable method for evaluating the change of breast density for risk management of women, or for evaluating the benefits/risks when considering hormonal replacement therapy or chemoprevention.
Figures
Similar articles
-
A new bias field correction method combining N3 and FCM for improved segmentation of breast density on MRI.Med Phys. 2011 Jan;38(1):5-14. doi: 10.1118/1.3519869. Med Phys. 2011. PMID: 21361169 Free PMC article.
-
Correlation between mammographic density and volumetric fibroglandular tissue estimated on breast MR images.Med Phys. 2004 Apr;31(4):933-42. doi: 10.1118/1.1668512. Med Phys. 2004. PMID: 15125012 Clinical Trial.
-
Quantitative analysis of breast parenchymal patterns using 3D fibroglandular tissues segmented based on MRI.Med Phys. 2010 Jan;37(1):217-26. doi: 10.1118/1.3271346. Med Phys. 2010. PMID: 20175484 Free PMC article.
-
Automated fibroglandular tissue segmentation and volumetric density estimation in breast MRI using an atlas-aided fuzzy C-means method.Med Phys. 2013 Dec;40(12):122302. doi: 10.1118/1.4829496. Med Phys. 2013. PMID: 24320533 Free PMC article.
-
Mammographic density. Measurement of mammographic density.Breast Cancer Res. 2008;10(3):209. doi: 10.1186/bcr2102. Epub 2008 Jun 19. Breast Cancer Res. 2008. PMID: 18598375 Free PMC article. Review.
Cited by
-
Opportunistic Breast Density Assessment in Women Receiving Low-dose Chest Computed Tomography Screening.Acad Radiol. 2016 Sep;23(9):1154-61. doi: 10.1016/j.acra.2016.05.003. Epub 2016 Jun 6. Acad Radiol. 2016. PMID: 27283069 Free PMC article.
-
A computerized volumetric segmentation method applicable to multi-centre MRI data to support computer-aided breast tissue analysis, density assessment and lesion localization.Med Biol Eng Comput. 2017 Jan;55(1):57-68. doi: 10.1007/s11517-016-1484-y. Epub 2016 Apr 22. Med Biol Eng Comput. 2017. PMID: 27106750 Free PMC article.
-
Proton density water fraction as a reproducible MR-based measurement of breast density.Magn Reson Med. 2022 Apr;87(4):1742-1757. doi: 10.1002/mrm.29076. Epub 2021 Nov 14. Magn Reson Med. 2022. PMID: 34775638 Free PMC article.
-
Comparison of breast density measured on MR images acquired using fat-suppressed versus nonfat-suppressed sequences.Med Phys. 2011 Nov;38(11):5961-8. doi: 10.1118/1.3646756. Med Phys. 2011. PMID: 22047360 Free PMC article.
-
Comparison of Dixon Sequences for Estimation of Percent Breast Fibroglandular Tissue.PLoS One. 2016 Mar 24;11(3):e0152152. doi: 10.1371/journal.pone.0152152. eCollection 2016. PLoS One. 2016. PMID: 27011312 Free PMC article.
References
-
- McCormack V. A. and dos Santos Silva I., “Breast density and parenchymal patterns as markers of breast cancer risk: A meta-analysis,” Cancer Epidemiol. Biomarkers Prev. ZZZZZZ 15 1159–1169 (2006). - PubMed
-
- Vachon C. M., Pankratz V. S., Scott C. G., Maloney S. D., Ghosh K., Brandt K. R., Milanese T., Carston M. J., and Sellers T. A., “Longitudinal trends in mammographic percent density and breast cancer risk,” Cancer Epidemiol. Biomarkers Prev. ZZZZZZ 16, 921–928 (2007). - PubMed
-
- Yaffe M. J., Boyd N. F., Byng J. W., Jong R. A., Fishell E., Lockwood G. A., Little L. E., and Tritchler D. K., “Breast cancer risk and measured mammographic density,” Eur. J. Cancer Prev. ZZZZZZ 7 Suppl 1, S47–55 (1998). - PubMed
-
- Boyd N. F., Dite G. S., Stone J., Gunasekara A., English D. R., McCredie M. R., Glies G. G., Tritchler D., Chiarelli A., Yaffe M. J., and Hopper J. L., “Heritability of mammographic density, a risk factor for breast cancer,” N. Engl. J. Med. NEJMAG10.1056/NEJMoa013390 347, 886–894 (2002). - DOI - PubMed
Publication types
MeSH terms
Grants and funding
LinkOut - more resources
Full Text Sources
Other Literature Sources
Medical
