

Automated regional registration and characterization of corresponding microcalcification clusters on temporal pairs of mammograms for interval change analysis
- PMID: 19175093
- PMCID: PMC2736718
- DOI: 10.1118/1.3002311
Automated regional registration and characterization of corresponding microcalcification clusters on temporal pairs of mammograms for interval change analysis
Abstract
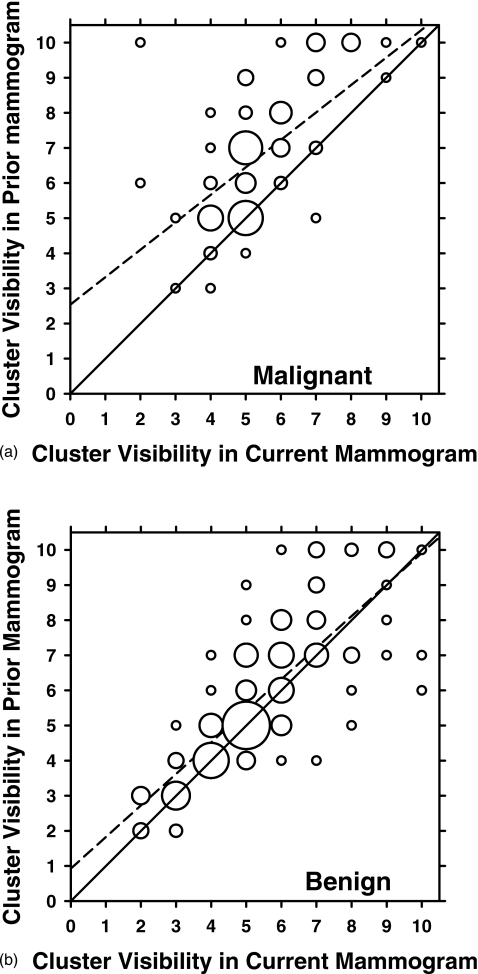
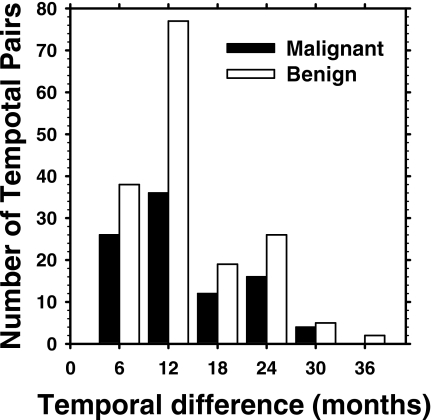
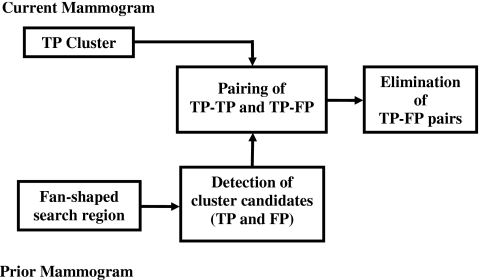
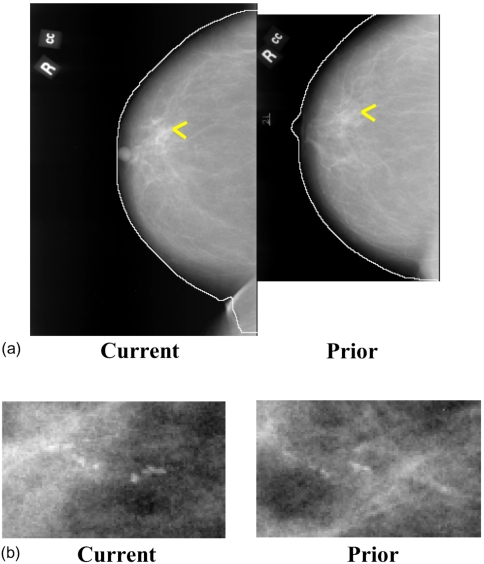
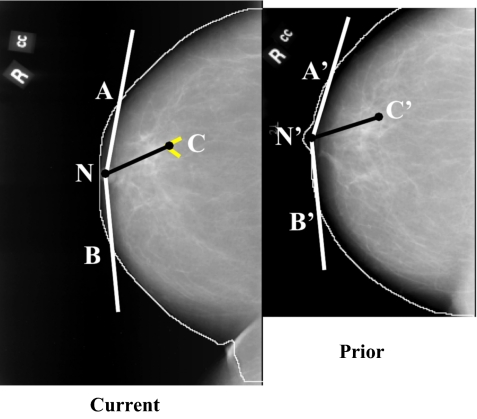
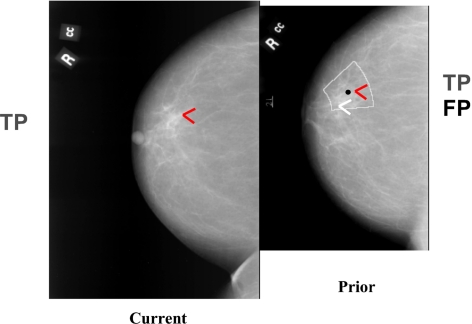
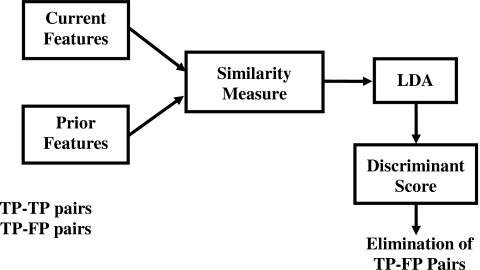
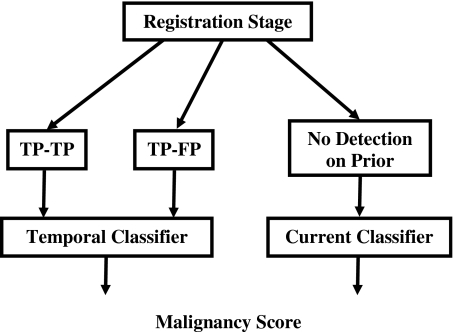
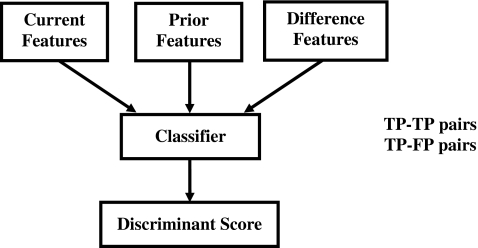
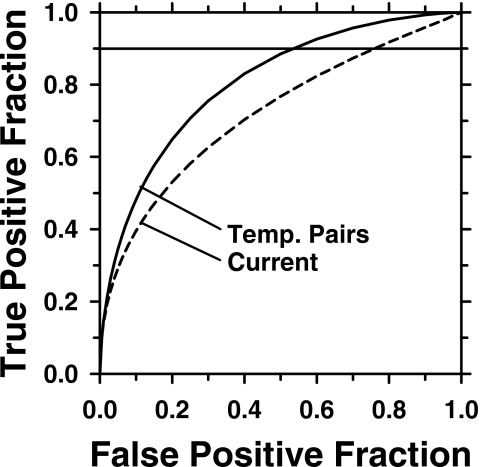
A computerized regional registration and characterization system for analysis of microcalcification clusters on serial mammograms is being developed in our laboratory. The system consists of two stages. In the first stage, based on the location of a detected cluster on the current mammogram, a regional registration procedure identifies the local area on the prior that may contain the corresponding cluster. A search program is used to detect cluster candidates within the local area. The detected cluster on the current image is then paired with the cluster candidates on the prior image to form true (TP-TP) or false (TP-FP) pairs. Automatically extracted features were used in a newly designed correspondence classifier to reduce the number of false pairs. In the second stage, a temporal classifier, based on both current and prior information, is used if a cluster has been detected on the prior image, and a current classifier, based on current information alone, is used if no prior cluster has been detected. The data set used in this study consisted of 261 serial pairs containing biopsy-proven calcification clusters. An MQSA radiologist identified the corresponding clusters on the mammograms. On the priors, the radiologist rated the subtlety of 30 clusters (out of the 261 clusters) as 9 or 10 on a scale of 1 (very obvious) to 10 (very subtle). Leave-one-case-out resampling was used for feature selection and classification in both the correspondence and malignant/benign classification schemes. The search program detected 91.2% (238/261) of the clusters on the priors with an average of 0.42 FPs/image. The correspondence classifier identified 86.6% (226/261) of the TP-TP pairs with 20 false matches (0.08 FPs/image) relative to the entire set of 261 image pairs. In the malignant/benign classification stage the temporal classifier achieved a test A(z) of 0.81 for the 246 pairs which contained a detection on the prior. In addition, a classifier was designed by using the clusters on the current mammograms only. It achieved a test A(z) of 0.72 in classifying the clusters as malignant and benign. The difference between the performance of the temporal classifier and the current classifier was statistically significant (p=0.0014). Our interval change analysis system can detect the corresponding cluster on the prior mammogram with high sensitivity, and classify them with a satisfactory accuracy.
Figures
Similar articles
-
Joint two-view information for computerized detection of microcalcifications on mammograms.Med Phys. 2006 Jul;33(7):2574-85. doi: 10.1118/1.2208919. Med Phys. 2006. PMID: 16898462 Free PMC article.
-
Computer aided detection of clusters of microcalcifications on full field digital mammograms.Med Phys. 2006 Aug;33(8):2975-88. doi: 10.1118/1.2211710. Med Phys. 2006. PMID: 16964876
-
Bilateral analysis based false positive reduction for computer-aided mass detection.Med Phys. 2007 Aug;34(8):3334-44. doi: 10.1118/1.2756612. Med Phys. 2007. PMID: 17879797 Free PMC article.
-
Computer-aided detection of clustered microcalcifications in digital breast tomosynthesis: a 3D approach.Med Phys. 2012 Jan;39(1):28-39. doi: 10.1118/1.3662072. Med Phys. 2012. PMID: 22225272 Free PMC article.
-
Computer Aided Detection of Clustered Microcalcification: A Survey.Curr Med Imaging Rev. 2019;15(2):132-149. doi: 10.2174/1573405614666181012103750. Curr Med Imaging Rev. 2019. PMID: 31975660 Review.
Cited by
-
Bladder Cancer Treatment Response Assessment in CT using Radiomics with Deep-Learning.Sci Rep. 2017 Aug 18;7(1):8738. doi: 10.1038/s41598-017-09315-w. Sci Rep. 2017. PMID: 28821822 Free PMC article.
-
Urinary bladder segmentation in CT urography using deep-learning convolutional neural network and level sets.Med Phys. 2016 Apr;43(4):1882. doi: 10.1118/1.4944498. Med Phys. 2016. PMID: 27036584 Free PMC article.
-
Deep learning of longitudinal mammogram examinations for breast cancer risk prediction.Pattern Recognit. 2022 Dec;132:108919. doi: 10.1016/j.patcog.2022.108919. Epub 2022 Jul 22. Pattern Recognit. 2022. PMID: 37089470 Free PMC article.
-
Bladder Cancer Segmentation in CT for Treatment Response Assessment: Application of Deep-Learning Convolution Neural Network-A Pilot Study.Tomography. 2016 Dec;2(4):421-429. doi: 10.18383/j.tom.2016.00184. Tomography. 2016. PMID: 28105470 Free PMC article.
-
A Review of Computer-Aided Breast Cancer Diagnosis Using Sequential Mammograms.Tomography. 2022 Dec 6;8(6):2874-2892. doi: 10.3390/tomography8060241. Tomography. 2022. PMID: 36548533 Free PMC article. Review.
References
-
- Feig S. A., D’Orsi C. J., Hendrick R. E., Jackson V. P., Kopans D. B., Monsees B., Sickles E. A., Stelling C. B., Zinninger M., and Wilcox-Buchalla P., “American College of Radiology guidelines for breast cancer screening,” AJR, Am. J. Roentgenol. AAJRDX 171, 29–33 (1998). - PubMed
-
- Bassett L. W., Shayestehfar B., and Hirbawi I., “Obtaining previous mammograms for comparison: Usefullness and costs,” AJR, Am. J. Roentgenol. AAJRDX 163, 1083–1086 (1994). - PubMed
-
- Burnside E. S., Sickles E. A., Sohlich R. E., and Dee K. E., “Differential value of comparison with previous examinations in diagnostic versus screening mammography,” AJR, Am. J. Roentgenol. AAJRDX 179, 1173–1177 (2002). - PubMed
-
- Chan H. P., Wei D., Lam K. L., Sahiner B., Helvie M. A., Adler D. D., and Goodsitt M. M., “Classification of malignant and benign microcalcifications by texture analysis,” Med. Phys. MPHYA6 22, 938 (1995). - PubMed
Publication types
MeSH terms
Grants and funding
LinkOut - more resources
Full Text Sources
Medical
Miscellaneous
