Model for the detection of signals in images with multiple suspicious locations
- PMID: 19175114
- PMCID: PMC2673618
- DOI: 10.1118/1.3002413
Model for the detection of signals in images with multiple suspicious locations
Abstract
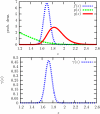
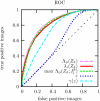
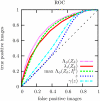
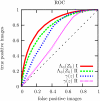
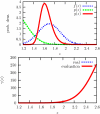
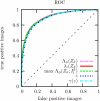
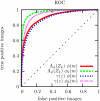
A signal detection model is presented that combines a signal model and a noise model providing mathematical descriptions of the frequency of appearance of the signals, and of the signal-like features naturally occurring in the background. We derive expressions for the likelihood functions for the whole ensemble of observed suspicious locations, in various possible combinations of signals and false signal candidates. As a result, this formalism is able to describe several new types of detection tests using likelihood ratio statistics. We have a global image abnormality test and an individual signal detection test. The model also provides an alternative mechanism in which is selected the combination of signal and noise features candidates that has the maximum likelihood. These tests can be analyzed with a variety of operating characteristic curves (ROC, LROC, FROC, etc.). In the mathematical formalism of the model, all the details characterizing the suspicious features are reduced to a single scalar function, which we name the signal specificity function, representing the frequency that a signal takes a certain value relative to the frequency of having a false signal with the same value in an image of given size. The signal specificity function ranks the degree of suspiciousness of the features found, and can be used to unify into a single score all the suspicious feature characteristics, and then apply the usual decision conventions as in the Swensson's detection model [Med. Phys. 23, 1709-1725 (1996)]. We present several examples in which these tests are compared. We also show how the signal specificity function can be used to model various degrees of accuracy of the observer's knowledge about image noise and signal statistical properties. Aspects concerning modeling of the human observer are also discussed.
Figures






Similar articles
-
Nonparametric signal detectability evaluation using an exponential transformation of the FROC curve.Med Phys. 2011 Oct;38(10):5690-702. doi: 10.1118/1.3633938. Med Phys. 2011. PMID: 21992384
-
Unified measurement of observer performance in detecting and localizing target objects on images.Med Phys. 1996 Oct;23(10):1709-25. doi: 10.1118/1.597758. Med Phys. 1996. PMID: 8946368 Review.
-
Maximum likelihood fitting of FROC curves under an initial-detection-and-candidate-analysis model.Med Phys. 2002 Dec;29(12):2861-70. doi: 10.1118/1.1524631. Med Phys. 2002. PMID: 12512721
-
ROC curves predicted by a model of visual search.Phys Med Biol. 2006 Jul 21;51(14):3463-82. doi: 10.1088/0031-9155/51/14/013. Epub 2006 Jul 6. Phys Med Biol. 2006. PMID: 16825743 Free PMC article.
-
Visual perception studies and observer models in medical imaging.Semin Nucl Med. 2011 Nov;41(6):419-36. doi: 10.1053/j.semnuclmed.2011.06.005. Semin Nucl Med. 2011. PMID: 21978445 Review.
References
-
- Adler R. J., “On excursion sets, tube formulas and maxima of random fields,” Ann. Appl. Probab. ZZZZZZ 10(1), 1–74 (2000).
-
- Hanley J. A. and McNeil B. J., “The meaning and use of the area under receiver operating characteristic (ROC) curve,” Radiology RADLAX 143, 29–36 (1982). - PubMed
Publication types
MeSH terms
Grants and funding
LinkOut - more resources
Full Text Sources
Research Materials

