. 2008 Dec;35(12):5738-47.
doi: 10.1118/1.3015197.

Dose calculation with respiration-averaged CT processed from cine CT without a respiratory surrogate

Affiliations

Dose calculation with respiration-averaged CT processed from cine CT without a respiratory surrogate

Adam C Riegel et al. Med Phys. 2008 Dec.

Abstract

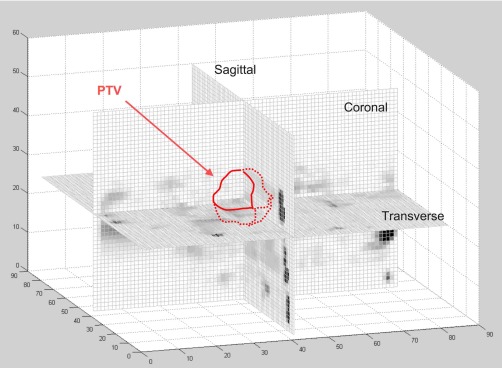
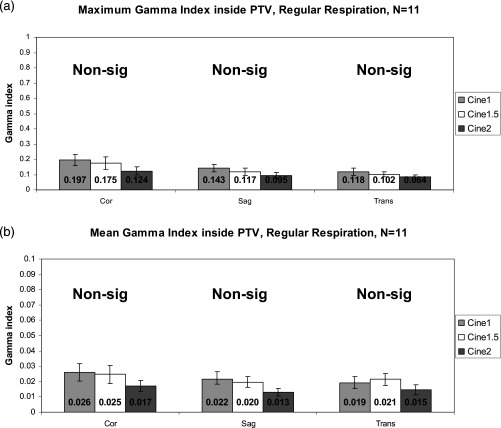
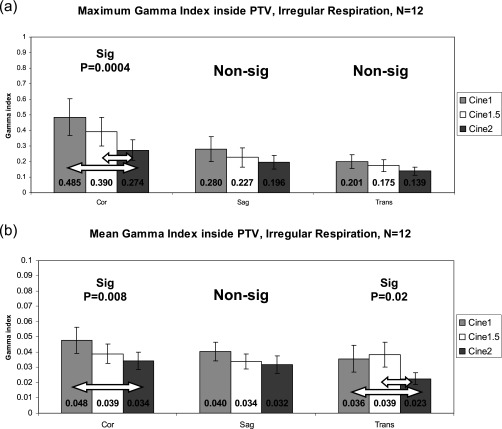
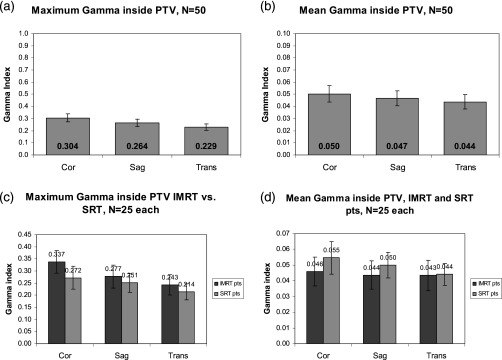
Dose calculation for thoracic radiotherapy is commonly performed on a free-breathing helical CT despite artifacts caused by respiratory motion. Four-dimensional computed tomography (4D-CT) is one method to incorporate motion information into the treatment planning process. Some centers now use the respiration-averaged CT (RACT), the pixel-by-pixel average of the ten phases of 4D-CT, for dose calculation. This method, while sparing the tedious task of 4D dose calculation, still requires 4D-CT technology. The authors have recently developed a means to reconstruct RACT directly from unsorted cine CT data from which 4D-CT is formed, bypassing the need for a respiratory surrogate. Using RACT from cine CT for dose calculation may be a means to incorporate motion information into dose calculation without performing 4D-CT. The purpose of this study was to determine if RACT from cine CT can be substituted for RACT from 4D-CT for the purposes of dose calculation, and if increasing the cine duration can decrease differences between the dose distributions. Cine CT data and corresponding 4D-CT simulations for 23 patients with at least two breathing cycles per cine duration were retrieved. RACT was generated four ways: First from ten phases of 4D-CT, second, from 1 breathing cycle of images, third, from 1.5 breathing cycles of images, and fourth, from 2 breathing cycles of images. The clinical treatment plan was transferred to each RACT and dose was recalculated. Dose planes were exported at orthogonal planes through the isocenter (coronal, sagittal, and transverse orientations). The resulting dose distributions were compared using the gamma index within the planning target volume (PTV). Failure criteria were set to 2%/1 mm. A follow-up study with 50 additional lung cancer patients was performed to increase sample size. The same dose recalculation and analysis was performed. In the primary patient group, 22 of 23 patients had 100% of points within the PTV pass y criteria. The average maximum and mean y indices were very low (well below 1), indicating good agreement between dose distributions. Increasing the cine duration generally increased the dose agreement. In the follow-up study, 49 of 50 patients had 100% of points within the PTV pass the y criteria. The average maximum and mean y indices were again well below 1, indicating good agreement. Dose calculation on RACT from cine CT is negligibly different from dose calculation on RACT from 4D-CT. Differences can be decreased further by increasing the cine duration of the cine CT scan.


Figures

Figure 1
Figure 1
Plot of sin(x) and the average of sin(x). Note that the average is zero at integer multiples of 2π. The variable x represents the cine duration of a cine CT exam. Increasing the cine duration decreases the variation from a one-period average. When x>2π, the maximum deviation from a one-period average is reached near 3π.
Figure 2
Figure 2
Overemphasis of certain parts of the respiratory pattern at each couch position. The entire shaded region represents the duration of the “beam on” time, i.e., the portion of the respiratory cycle imaged at each couch position. The light shaded region is one period, the dark shaded region is any part of the breathing cycle beyond one period that will be included in the averaging and will “weight” the average towards that part of the respiratory cycle. Note that different phases of the respiratory pattern are captured each cine duration, weighting a different part of the pattern at each couch position.
Figure 3
Figure 3
Intersection of orthogonal dose planes with PTV. Mean and maximum gamma (γ) indices were calculated on each of these intersections for all patients.
Figure 4
Figure 4
Gamma (γ) indices inside the PTV for the primary patient group, regular respiratory patterns. (a) Maximum γ. (b) Mean γ (note the y-axis scale). Error bars are standard error (N=11). Note that γ generally decreases as cine duration increases.
Figure 5
Figure 5
Gamma (γ) indices inside the PTV for the primary patient group, irregular respiratory patterns. (a) Maximum γ. (b) Mean γ (note the y-axis scale). Error bars are standard error (N=12). Arrows indicate statistically significant differences by ANOVA/Tukey HSD tests. Again, note that γ generally decreases as cine duration increases.
Figure 6
Figure 6
Gamma (γ) indices inside the PTV for the follow-up patient group. (a) Maximum γ. (b) Mean γ (note the y-axis scale). (c) Maximum γ, separated by treatment technique. (d) Mean γ, separated by treatment technique. Error bars are standard error.
Figure 7
Figure 7
Patient 40, follow-up group. (a) Coronal RACT4D-CT. (b) Coronal gamma (γ) distribution, RACTcine vs RACT4D-CT. This was the only patient in the follow up group to have any points inside the PTV fail our criteria (1%). Note the regions of high γ at the inferior and superior regions of the tumor.
Figure 8
Figure 8
Shadowing effect, illustrated by calculating dose on the end-inspiration and end-expiration phases of 4D-CT for one oblique beam. (a) Difference CT image, taken by subtracting the end-inspiration image from the end-expiration image. Circled structures show large differences in CT number. (b) The gamma (γ) distribution obtained by comparing the two distributions. Circles have been redrawn on the γ distribution to highlight the effect of the large change in CT number. Note the long shadows of disagreement behind the moving anatomy. The two extremes of respiratory motion were chosen to exaggerate the difference in anatomical position and subsequent dose calculation.
Figure 9
Figure 9
Patient 20, primary group. (a) Coronal RACTcine1.5. (b) Transverse RACTcine1.5. (c) Coronal gamma (γ), RACTcine1.5 vs RACT4D-CT. (d) Transverse γ, RACTcine1.5 vs RACT4D-CT. This patient exhibits the shadowing effect described. Note the vague stripe behind the area of high disagreement on the superior/lateral edge of the PTV on the coronal view [(a), (c)]. The transverse view [(b), (d)] was taken through this area of high disagreement. Again, note the stripes behind the structures highlighted by arrows. The γ index on both views was still far below our 2%1mm failure criteria.

References

    1. Rietzel E. et al., “Four-dimensional image-based treatment planning: Target volume segmentation and dose calculation in the presence of respiratory motion,” Int. J. Radiat. Oncol., Biol., Phys. IOBPD310.1016/j.ijrobp.2004.11.037 61, 1535–1550 (2005). - DOI - PubMed
    1. D’Souza W. D. et al., “The use of gated and 4D CT imaging in planning for stereotactic body radiation therapy,” Med. Dosim. ZZZZZZ 32, 92–101 (2007). - PubMed
    1. Rietzel E. et al., “Design of 4D treatment planning target volumes,” Int. J. Radiat. Oncol., Biol., Phys. IOBPD310.1016/j.ijrobp.2006.05.024 66, 287–295 (2006). - DOI - PubMed
    1. Underberg R. W. et al., “Four-dimensional CT scans for treatment planning in stereotactic radiotherapy for stage I lung cancer,” Int. J. Radiat. Oncol., Biol., Phys. IOBPD310.1016/j.ijrobp.2004.07.665 60, 1283–1290 (2004). - DOI - PubMed
    1. Underberg R. W. et al., “Benefit of respiration-gated stereotactic radiotherapy for stage I lung cancer: an analysis of 4DCT datasets,” Int. J. Radiat. Oncol., Biol., Phys. IOBPD310.1016/j.ijrobp.2005.01.032 62, 554–560 (2005). - DOI - PubMed

Publication types

MeSH terms