. 2009 Apr 10;284(15):10138-49.
doi: 10.1074/jbc.M806825200. Epub 2009 Jan 27.

Presenilin 1 affects focal adhesion site formation and cell force generation via c-Src transcriptional and posttranslational regulation

Affiliations

Presenilin 1 affects focal adhesion site formation and cell force generation via c-Src transcriptional and posttranslational regulation

Dieter Waschbüsch et al. J Biol Chem. .

Abstract

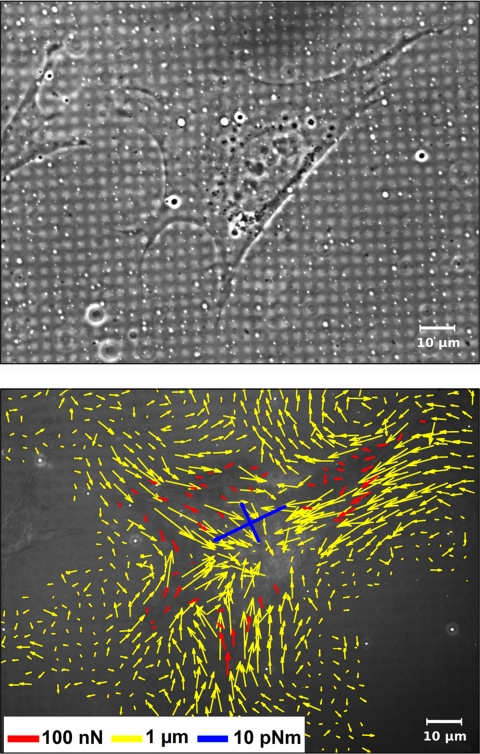
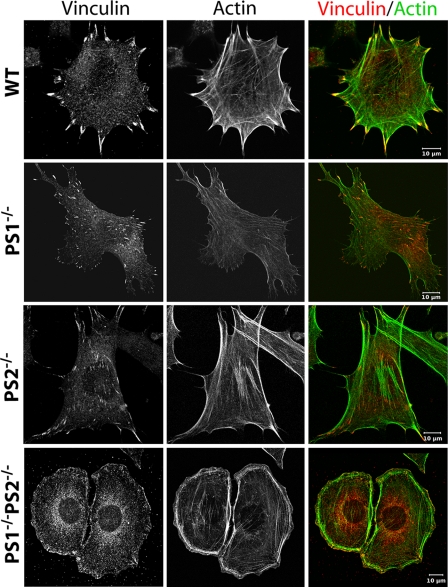
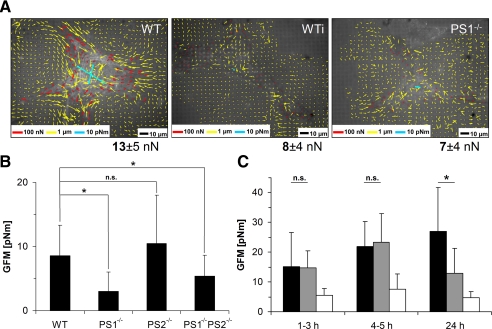
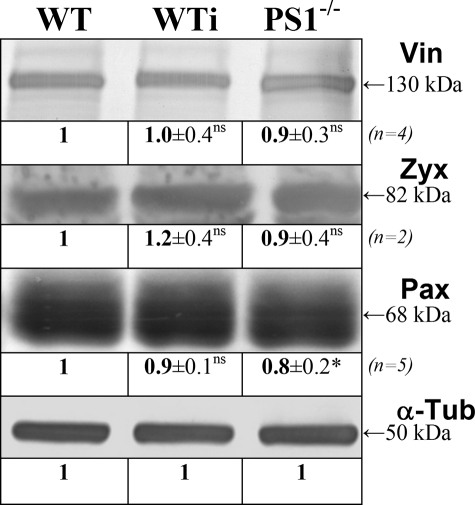
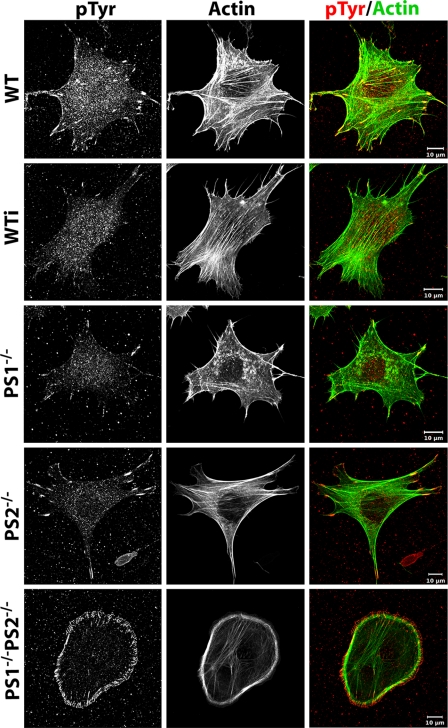
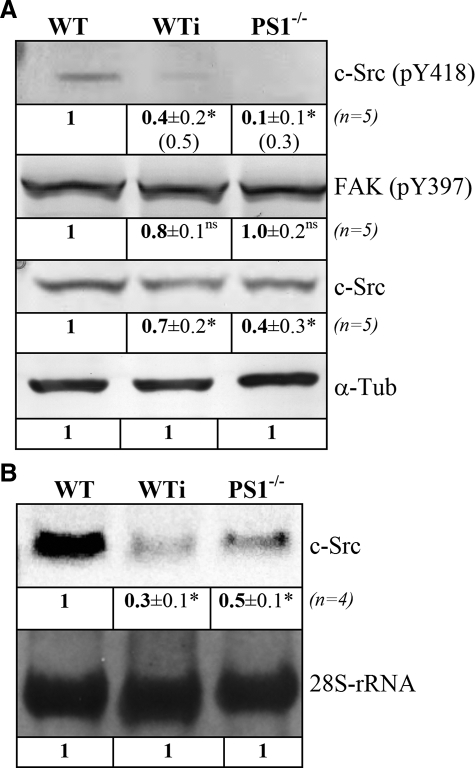
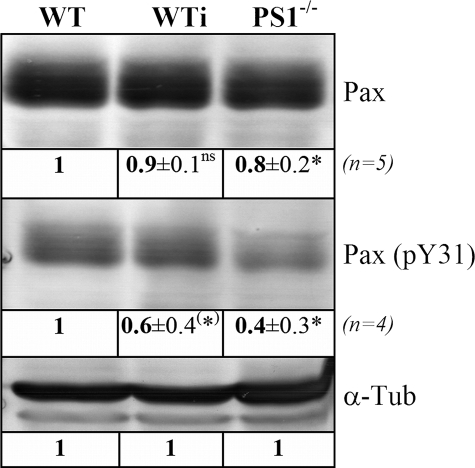
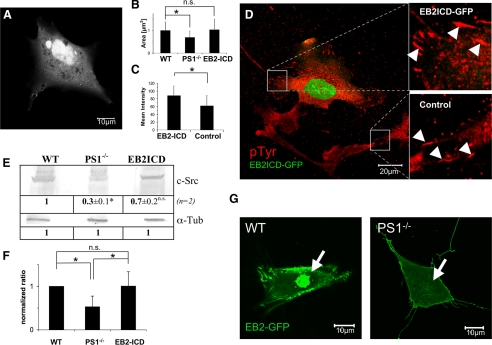
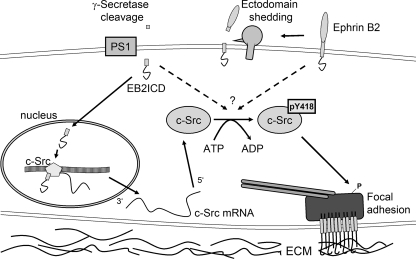
Presenilin 1 and 2 (PS) are critical components of the gamma-secretase complex that cleaves type I transmembrane proteins within their transmembrane domains. This process leads to release of proteolytically processed products from cellular membranes and plays an essential role in signal transduction or vital functions as cell adhesion. Here we studied the function of presenilins in cell-matrix interaction of wild-type and PS knock-out mouse embryonic fibroblasts. We found for PS1(-/-) cells an altered morphology with significantly reduced sizes of focal adhesion sites compared with wild type. Cell force analyses on micropatterned elastomer films revealed PS1(-/-) cell forces to be reduced by 50%. Pharmacological inhibition confirmed this function of gamma-secretase in adhesion site and cell force formation. On the regulatory level, PS1 deficiency was associated with strongly decreased phosphotyrosine levels of focal adhesion site-specific proteins. The reduced tyrosine phosphorylation was caused by a down-regulation of c-Src kinase activity primarily at the level of c-Src transcription. The direct regulatory connection between PS1 and c-Src could be identified with ephrinB2 as PS1 target protein. Overexpression of ephrinB2 cytoplasmic domain resulted in its nuclear translocation with increased levels of c-Src and a full complementation of the PS1(-/-) adhesion and phosphorylation phenotype. Cleavage of full-length EB2 and subsequent intracellular domain translocation depended on PS1 as these processes were only found in WT cells. Therefore, we conclude that gamma-secretase is vital for controlling cell adhesion and force formation by transcriptional regulation of c-Src via ephrinB2 cleavage.


Figures

FIGURE 1.
FIGURE 1.
From substrate deformation to cell force. MEF WT cells were incubated on micropatterned elastic substrates (Young's modulus 13 kilopascals) for 1 day and analyzed in phase contrast (top) as well as in RICM to detect FAs and the deformed micropattern (not shown). The deformation field (yellow arrows) was determined by comparison to a regular grid using digital image processing. Employing elasticity theory, cell forces were calculated at every single FA (red arrows). Additionally a measure for the sum of all contractile forces is given as a generalized first moment (blue arrows).
FIGURE 2.
FIGURE 2.
Focal adhesions and actin cytoskeleton of MEF mutants. WT and PS mutant strains were incubated for 1 day, fixed, and subsequently stained for vinculin (left) and actin (middle). An overlay of both stainings is given on the right. Note the reduced size of FAs and stress fibers in PS1-/- compared with WT and the complete switch in cell morphology in PS1-/-PS2-/- double mutant strains. Throughout the whole experiment all cell types were treated identically and analyzed at a confocal microscope with unchanged microscopic and image processing configurations compared with WT.
FIGURE 3.
FIGURE 3.
Cell force analysis upon PS deficiency. Wild-type as well as PS mutant strains were incubated on 13-kPa elastic polydimethylsiloxane substrates for 1 day and subsequently analyzed for cell force application. Cell forces were characterized at every FA (A) as well as by the GFM (B and C). A, cell force evaluation for WT (left, wild-type cells treated with DAPT for 24 h (WTi, middle) and PS1-/- mutant cells (right). Color coding is as in Fig. 1. Below each micrograph the average force per focal adhesion is given together with its S.D. B, GFMs for randomly chosen cells. n(WT) = 86, n(PS1-/-) = 36, n(PS2-/-) = 72, n(PS1-/-PS2-/-) = 64. Error bars denote S.D. C, WT (black), DAPT-treated WT (gray) and PS1-/- (white) cells were analyzed for cell force application over time. Cell force analysis started immediately after spreading. Generalized first moments are given at indicated times. For each result given in A and C, at least eight cells were analyzed. Note the differences in average GFMs between B and C. These differences result from different cell picking methods. In B all cells in a given area were analyzed, and in C only cells exhibiting focal adhesions already at early stages were chosen. Therefore, this selection is biased toward strongly contracting cells.
FIGURE 4.
FIGURE 4.
Independency of FA protein expression upon PS deficiency. WT and PS1-/- as well as DAPT treated WT cells (WTi) were harvested after 24 h, and crude protein extracts were analyzed in Western blot analyses. Protein concentrations were equalized using tubulin (α-Tub) as constitutively expressed marker protein. Crude extracts were subsequently analyzed for the indicated proteins. All relative protein concentrations including S.D. given below the bands are normalized with the original band intensity determined in the α-tubulin control. In addition, all values of each line were divided by the corresponding WT value. The apparent molecular weight of the given protein bands is indicated on the right. Please note that Western analyses against zyxin and paxillin showed some unspecific background staining (not shown). Vin, vinculin; Zyx, zyxin; Pax, paxillin; *, significantly different from wild-type (p < 0.05); ns, not significantly different (p > 0.05).
FIGURE 5.
FIGURE 5.
Tyrosine phosphorylation of focal adhesion sites. WT and PS mutant strains as well as WT cells treated with DAPT for 24 h (WTi) were grown on glass, fixed, and subsequently stained for phosphotyrosine (left) as well as actin (middle). Their overlay is given in color (right). Scale bar, 20 μm. Note the strongly diminished phosphotyrosine level in PS1-/- cells as well as in DAPT-treated cells. Image acquisition is as described in Fig. 2.
FIGURE 6.
FIGURE 6.
Levels of c-Src phosphorylation and expression. A, Western analyses. Crude protein extracts from WT and PS1-/- as well as WT cells treated with DAPT (WTi) for 24 h were separated by SDS-page and used for Western blot analyses against c-Src. In addition, phosphotyrosine-specific antibodies against tyrosine 418 of c-Src and tyrosine 397 of focal adhesion kinase were used. Protein concentrations were equalized using α-tubulin (α-Tub) as a constitutively expressed standard. Numbers given in brackets for c-Src (pY418) in WTi and PS1-/- indicate protein amounts normalized to total levels of c-Src. B, Northern analyses. Same cell types as in A were harvested after 24 h, and total RNA was isolated. Total RNA was separated under formaldehyde conditions, and RNA concentrations were equalized for 28 SrRNA. Northern blot analyses were performed with digoxigenin-labeled probes against c-Src mRNA. Relative changes in protein (A) or mRNA (B) levels as well as their S.D. are indicated below each signal and were determined as described in Fig. 4. *, significantly different from wild-type (p < 0.05); ns, not significantly different (p > 0.05).
FIGURE 7.
FIGURE 7.
Dependence of paxillin phosphorylation on PS1. Crude protein extracts from WT and PS1-/- as well as DAPT-treated WT cells (WTi) were separated by SDS-PAGE and equalized for α-tubulin (α-Tub). Subsequently, Western blot analyses against paxillin (Pax) and phosphorylated tyrosine 31 of paxillin (Pax pY31) were performed. Relative changes in protein levels were determined as described in Fig. 4 and are indicated below each signal. Western analyses were performed four times with each antibody from independent protein isolations. *, significantly different from wild-type (p < 0.05); (*), significantly different from wild-type (p = 0.05); ns, not significantly different (p > 0.05).
FIGURE 8.
FIGURE 8.
Effects of EphrinB2 cytoplasmic domain expression in PS1-/- cells. After transfection with EB2ICD-GFP, cells were grown for 2 days. Thereafter, cells were either used for western or RT-PCR analyses. Alternatively, cells were analyzed by confocal live cell microscopy or fixed and immunostained for marker proteins following by confocal imaging. A, nuclear localization of EB2ICD-GFP in living MEF PS1-/- cells. B, quantification of average focal adhesion size. Cells were immunocytochemically labeled for paxillin. Using ImageJ as software, sizes of randomly chosen focal adhesions were determined. WT, n = 100 FAs, 6 cells; PS1-/-, n = 100 FAs, 16 cells; EB2ICD, n = 100 FAs, 11 cells. C, quantification of tyrosine phosphorylation of FAs was performed using a phosphotyrosine specific antibody and ImageJ as software. Values are given in % relative to WT. EB2ICD, n = 150 FAs, 16 cells; PS1-/-, n = 150 FAs, 11 cells. D, exemplary confocal image of phosphotyrosine-immunolabeled cells. EB2ICD-GFP-expressing PS1-/- cells are characterized by a strong nuclear GFP signal and intensively phosphorylated, large FAs (upper square, right). Both are absent in untransfected cells (lower square, right). FAs are indicated by white arrowheads. E, Western analyses of PS1-/- cells and PS1-/- cells additionally expressing EB2ICD-GFP (EB2ICD) were quantified for c-Src protein levels and compared with WT (n = 2). Protein concentrations were equalized using α-tubulin (α-Tub). F, normalized ΔΔCT values with c-Src specific primers in qRT-PCR experiments for the indicated strains (n = 5). Note that the doubled c-Src mRNA level of EB2-ICD-expressing PS1-/- cells (EB2-ICD) was found in the total mRNA pool, although just 10% of all cells were transfected. *, significantly different from WT; ns, not significantly different from WT (p < 0.05). G, WT and PS1-/- cells were transfected with a full-length EB2-GFP construct and analyzed for ephrin nuclear translocation. Note that high level expression of EB2-GFP was toxic to all cells analyzed. Nuclear translocation could, therefore, be analyzed only within the first 20 h after transfection.
FIGURE 9.
FIGURE 9.
Model of c-Src regulation. Transmembrane proteins as e.g. ephrins or cadherin/catenin are subject of ADAM (a disintegrin and metalloprotease)-dependent shedding and subsequent PS-dependent cleavage processes. This mechanism frees the remaining transmembrane domains from the membrane. Hence, the freed EphrinB2 intracellular domain functions as coactivator for c-Src transcription. In addition, interaction of expressed c-Src with a stub fragment or directly with a transmembrane protein positively regulates c-Src autophosphorylation and, therefore, its function to phosphorylate focal adhesion-specific proteins. These phosphorylation events are essential for maturation of focal adhesion sites and, therefore, for stable cell-matrix interactions. ECM, extracellular matrix.

References

    1. De Strooper, B., Saftig, P., Craessaerts, K., Vanderstichele, H., Guhde, G., Annaert, W., Von Figura, K., and Van Leuven, F. (1998) Nature 391 387-390 - PubMed
    1. De Strooper, B., Annaert, W., Cupers, P., Saftig, P., Craessaerts, K., Mumm, J. S., Schroeter, E. H., Schrijvers, V., Wolfe, M. S., Ray, W. J., Goate, A., and Kopan, R. (1999) Nature 398 518-522 - PubMed
    1. Xia, W., and Wolfe, M. S. (2003) J. Cell Sci. 116 2839-2844 - PubMed
    1. Maretzky, T., Reiss, K., Ludwig, A., Buchholz, J., Scholz, F., Proksch, E., de Strooper, B., Hartmann, D., and Saftig, P. (2005) Proc. Natl. Acad. Sci. U. S. A. 102 9182-9187 - PMC - PubMed
    1. Tomita, T., Tanaka, S., Morohashi, Y., and Iwatsubo, T. (2006) Mol. Neurodegener. 1 2. - PMC - PubMed

LinkOut - more resources