. 2009 Jan 27;2(55):ra2.
doi: 10.1126/scisignal.2000189.

Differential requirement of mTOR in postmitotic tissues and tumorigenesis

Affiliations

Differential requirement of mTOR in postmitotic tissues and tumorigenesis

Caterina Nardella et al. Sci Signal. .

Abstract

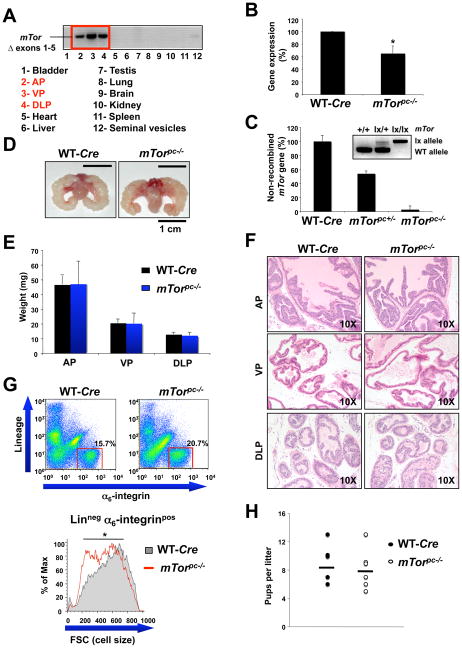
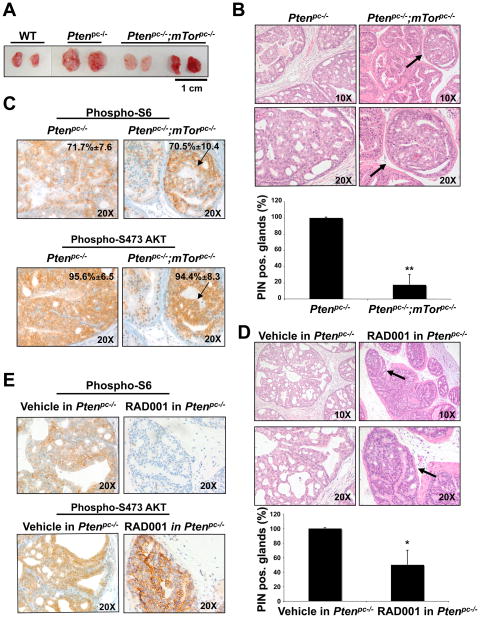
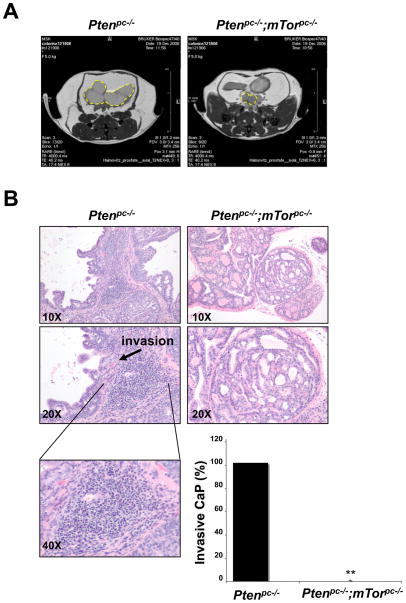
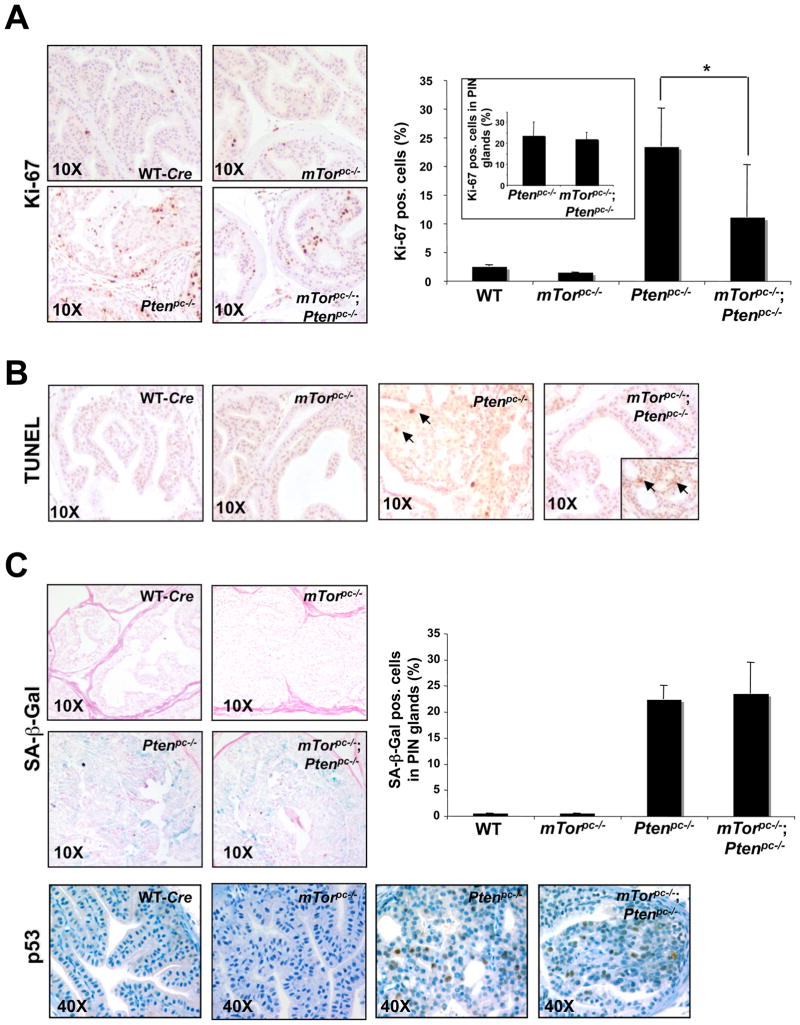
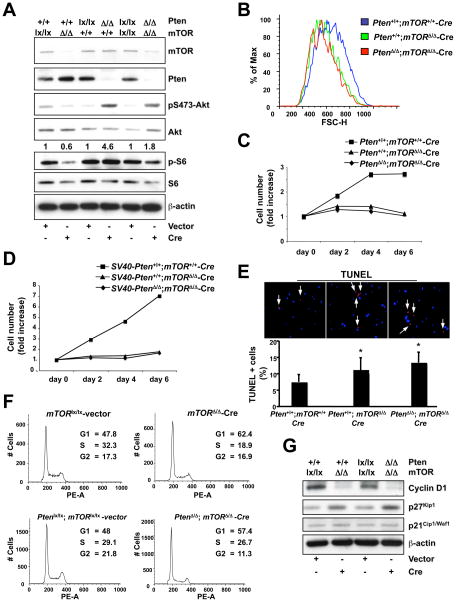
The mammalian target of rapamycin (mTOR) is a crucial effector in a complex signaling network commonly disrupted in cancer. mTOR exerts its multiple functions in the context of two different multiprotein complexes: mTOR complex 1 (mTORC1) and mTOR complex 2 (mTORC2). Loss of the tumor suppressor PTEN (phosphatase and tensin homolog deleted from chromosome 10) can hyperactivate mTOR through AKT and represents one of the most frequent events in human prostate cancer. We show here that conditional inactivation of mTor in the adult mouse prostate is seemingly inconsequential for this postmitotic tissue. Conversely, inactivation of mTor leads to a marked suppression of Pten loss-induced tumor initiation and progression in the prostate. This suppression is more pronounced than that elicited by the sole pharmacological abrogation of mTORC1. Acute inactivation of mTor in vitro also highlights the differential requirement of mTor function in proliferating and transformed cells. Collectively, our data constitute a strong rationale for developing specific mTOR inhibitors targeting both mTORC1 and mTORC2 for the treatment of tumors triggered by PTEN deficiency and aberrant mTOR signaling.


Figures

Figure 1
Figure 1. Effect of mTor conditional inactivation in the mouse prostate
(A) PCR analysis to detect recombination of mTorΔ allele on DNA from several mouse tissues. AP, VP and DLP stand for anterior prostate, ventral prostate and dorsolateral prostate respectively. (B) mTor quantitative RT-PCR analysis of the prostate mRNA from WT and mTorpc−/− mice. Error bars show S.D. from three independent experiments. *, P < 0.05. (C) mTor genomic quantitative real-time PCR on DNA extracted from laser capture micro-dissected (LCM) epithelial cells of WT, mTorpc+/− and mTorpc−/− mice prostates. The inset shows the genotyping by PCR of the DNA extracted from the prostatic epithelial cells obtained by LCM and subsequently analyzed by genomic quantitative real-time PCR. (D) Representative images of prostates from mTorpc−/− and wild-type (WT) 3 month old mice. (E) Weights of prostate from mTorpc−/− and WT mice. Error bars show S.D. in the weight of 5 mice from each genotype. (F) Hematoxylin/Eosin (H&E) staining of AP, VP and DLP sections from the same mice showed in (D). (G) Upper panel: cell suspensions from mTorpc−/− and WT mouse prostates stained with lineage markers (CD31, CD45, Ter119) and for α6-integrin (CD49f). Gates indicate the Lineage negative, α6-integrin positive, basal epithelial cell population. Lower panel: representative overlay histogram of mTorpc−/− and WT basal epithelial cell Forward Scatter (FSC), an indicator of cell size. *, P < 0.05. (H) Size of the litters from WT and mTorpc−/− males at 3 months of age. There is not significant difference between the litters from WT and mTorpc−/− males.
Figure 2
Figure 2. Genetic inactivation of mTor suppresses Pten-null driven prostate tumorigenesis more efficiently than does treatment with RAD001
(A) Representative images of prostates from 3 month old WT, Ptenpc−/− and Ptenpc−/−;mTorpc−/− mice. (B) Upper panel: H&E staining of AP sections from 3 month old Ptenpc−/− and Ptenpc−/−;mTorpc−/− mice. An example of residual PIN lesion in Ptenpc−/−;mTorpc−/− mouse prostate is indicated by the arrow and shown at higher magnification. Lower panel: percentage of glands affected by PIN in the prostate of 3 month old Ptenpc−/− and Ptenpc−/−;mTorpc−/− mice. Error bars show S.D. in the number of glands affected by PIN in 4 mice from each genotype. **, P < 0.01. (C) IHC staining of PIN lesions present in the prostates of Ptenpc−/− and Ptenpc−/−;mTorpc−/− mice showed in (B upper panel) with anti-phospho S6 and anti-phospho S473 Akt antibodies. Quantification (+/− SD) of phospho-S6 and phospho-Akt positive cells in the PIN lesions of Ptenpc−/− and Ptenpc−/−;mTorpc−/− mice is indicated. (D) Upper panel: H&E staining of AP sections from 8 weeks old Ptenpc−/− mice treated with vehicle or RAD001 for 4 weeks. One of the residual PIN lesions in RAD001-treated Ptenpc−/− mouse prostate is indicated by the arrow and shown at higher magnification. Lower panel: percentage of glands affected by PIN in the prostate of 8 weeks old Ptenpc−/− mice treated with vehicle or RAD001 for 4 weeks. Error bars show S.D. in the number of glands affected by PIN in 4 vehicle-treated and 4 RAD001-treated Ptenpc−/− mice. *, P < 0.05. (E) IHC staining of PIN lesions present in the prostate of the Ptenpc−/− mice treated with vehicle or RAD001 shown in D upper panel) with antibodies directed against phospho-S6 and phospho S473 Akt.
Figure 3
Figure 3. mTor inactivation opposes Pten-loss induced tumor progression from in situ to invasive cancer lesions
(A) MRI analysis of prostatic tumors (dashed yellow circles) in Ptenpc−/− and Ptenpc−/−;mTorpc−/− 6 month old mice. (B) H&E staining of AP sections from 6 month old Ptenpc−/− and Ptenpc−/−;mTorpc−/− mice. Focal invasion in Ptenpc−/− mouse prostate is indicated by an arrow. Inflammatory infiltration in Ptenpc−/− mouse prostate is shown at higher magnification in the lower left panel. Lower right panel: percentage of Ptenpc−/− and Ptenpc−/−;mTorpc−/− 6 month old mice with signs of invasion in the prostate. Four mice from each genotyping were analyzed. **, P < 0.01.
Figure 4
Figure 4. Biological outcome of mTor deletion in the WT and Ptenpc−/− prostate
(A) Left panel: Ki-67 staining on prostate sections from 3 month old mice of the indicated genotypes. Right panel: quantification of Ki-67. Pos. stands for positive. Three different areas of one section were counted to determine an average and representative value for each slide. Slides from three independent mice were counted in this way to determine a standard deviation for the population. *, P < 0.05. The inset shows the Ki-67 quantification exclusively in the PIN lesions of the Ptenpc−/− and Ptenpc−/−;mTorpc−/− mice prostates. (B) TUNEL assay for apoptosis on prostate sections from 3 month old mice of the indicated genotypes. The arrows show examples of TUNEL positive cells. The inset in the Ptenpc−/−;mTorpc−/− prostate section shows the TUNEL staining in a residual PIN lesion. (C) Upper left panel: senescence-associated β-Galactosidase staining (SA β-Gal) on prostate sections from 3 month old mice of the indicated genotypes. Upper right panel: quantification of the SA β-Gal staining in the glands affected by PIN of the prostate sections from 3 month old mice of the indicated genotypes. Quantifications were done on three representative sections from three mice. There is not significant difference between the PIN lesions of Ptenpc−/− and Ptenpc−/−;mTorpc−/− prostates. Pos. stands for positive. Lower panel: IHC for p53 on the same mice showed in the upper panel.
Figure 5
Figure 5. Biological outcome of mTor deletion in mouse embryonic fibroblasts (MEFs)
(A) Western blot analysis of lysates of mTorloxP/loxP, PtenloxP/loxP and PtenloxP/loxP;mTorloxP/loxP MEFs infected with PURO-IRES-GFP (vector) or Cre-PURO-IRES-GFP (Cre) (see experimental timeline shown in Supplementary Fig. 3A). Quantification of the phospho-Akt/total Akt ratio is shown. Quantifications were done by densitometry analysis performed with ImageJ software. For each genotyping the phopho-Akt/total Akt value of Cre-infected cells is normalized against the corresponding vector-infected control. (B) Flow cytometric analysis (Forward Scatter, FSC-H) of the mTor-null (Pten+/+;mTorΔ/Δ-Cre) and Pten;mTor-double null MEFs (PtenrΔ/Δ;mTorΔ/Δ-Cre) compared to the WT (Pten+/+;mTor+/+-Cre). (C) Cell proliferation curve analysis of the same MEFs analyzed in (B) followed over a 6-day period. (D) Cell proliferation curve analysis of mTorloxP/loxP and PtenloxP/loxP;mTorloxP/loxP primary MEFs firstly immortalized with SV40 large-T antigen, and subsequently infected with PURO-IRES-GFP (vector) or Cre-PURO-IRES-GFP (Cre). (E) TUNEL assay on the same MEFs analyzed in (B). *, P < 0.05. (F) Flow cytometric analysis of mTorloxP/loxP and PtenloxP/loxP;mTorloxP/loxP MEFs infected with PURO-IRES-GFP (vector) or Cre-PURO-IRES-GFP (Cre) (see experimental timeline shown in Supplementary Fig. 3A). In order to accurately evaluate cell cycle populations, data was gated to exclude the sub-G1 population. (G) Western blot analysis on the lysates of mTorloxP/loxP and PtenloxP/loxP;mTorloxP/loxP MEFs infected with PURO-IRES-GFP (vector) or Cre-PURO-IRES-GFP (Cre) (see experimental timeline shown in Supplementary Fig. 3A).

References

    1. Wullschleger S, Loewith R, Hall MN. TOR signaling in growth and metabolism. Cell. 2006;124:471–84. - PubMed
    1. Heitman J, Movva NR, Hall MN. Targets for cell cycle arrest by the immunosuppressant rapamycin in yeast. Science (New York, NY. 1991;253:905–9. - PubMed
    1. Easton JB, Houghton PJ. mTOR and cancer therapy. Oncogene. 2006;25:6436–46. - PubMed
    1. Majumder PK, Sellers WR. Akt-regulated pathways in prostate cancer. Oncogene. 2005;24:7465–74. - PubMed
    1. Bhaskar PT, Hay N. The two TORCs and Akt. Developmental cell. 2007;12:487–502. - PubMed

Publication types

LinkOut - more resources