. 2009 Mar 27;284(13):8233-40.
doi: 10.1074/jbc.M809338200. Epub 2009 Jan 28.

Molecular mechanisms of thioredoxin and glutaredoxin as hydrogen donors for Mammalian s phase ribonucleotide reductase

Affiliations

Molecular mechanisms of thioredoxin and glutaredoxin as hydrogen donors for Mammalian s phase ribonucleotide reductase

Farnaz Zahedi Avval et al. J Biol Chem. .

Abstract

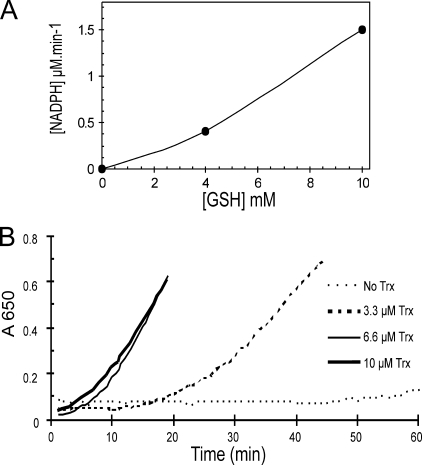
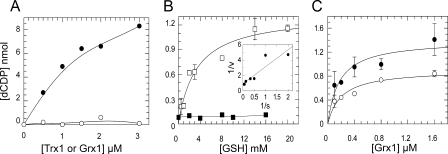
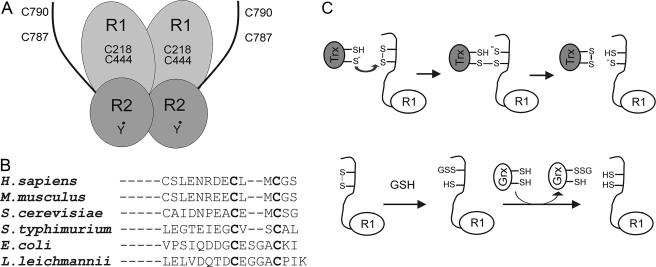
Ribonucleotide reductase (RNR) catalyzes the rate-limiting step in deoxyribonucleotide synthesis essential for DNA replication and repair. RNR in S phase mammalian cells comprises a weak cytosolic complex of the catalytic R1 protein containing redox active cysteine residues and the R2 protein harboring the tyrosine free radical. Each enzyme turnover generates a disulfide in the active site of R1, which is reduced by C-terminally located shuttle dithiols leaving a disulfide to be reduced. Electrons for reduction come ultimately from NADPH via thioredoxin reductase and thioredoxin (Trx) or glutathione reductase, glutathione, and glutaredoxin (Grx), but the mechanism has not been clarified for mammalian RNR. Using recombinant mouse RNR, we found that Trx1 and Grx1 had similar catalytic efficiency (k(cat)/K(m)). With 4 mm GSH, Grx1 showed a higher affinity (apparent K(m) value, 0.18 microm) compared with Trx1 which displayed a higher apparent k(cat), suggesting its major role in S phase DNA replication. Surprisingly, Grx activity was strongly dependent on GSH concentrations (apparent K(m) value, 3 mm) and a Grx2 C40S mutant was active despite only one cysteine residue in the active site. This demonstrates a GSH-mixed disulfide mechanism for glutaredoxin catalysis in contrast to the dithiol mechanism for thioredoxin. This may be an advantage with the low levels of RNR for DNA repair or in tumor cells with high RNR and no or low Trx expression. Our results demonstrate mechanistic differences between the mammalian and canonical Escherichia coli RNR enzymes, which may offer an explanation for the nonconserved shuttle dithiol sequences in the C terminus of the R1.


Figures

FIGURE 1.
FIGURE 1.
Initial rate of RNR assay with different concentrations of R1 depending on time and electron donor. A, four series of samples with different concentrations of R1 and constant 36 μg/ml R2 were assayed using 10 mm DTT as reductant. The reaction was stopped after the desired time. B, a range of 0–150 μg/ml R1 was assayed with 36 μg/ml R2 within 45 min of incubation time. Each concentration was checked with the Trx system: 4 μm Trx1, 1 mm NADPH, and 0.1 μm TrxR (•); or the Grx system: 1.76 μm Grx1, 1 mm NADPH, 10 mm GSH, and 0.1 μm GR (○); and 10 mm DTT (*).
FIGURE 2.
FIGURE 2.
Characterization of mouse RNR subunits. Different concentrations of R1 with 74 μg/ml R2 (A) or different concentrations of R2 with 110 μg/ml R1 (B) were assayed for 30 min incubation time in a total volume of 50 μl. As electron donor a Trx system containing 3 μm Trx1, 1 mm NADPH, and 0.1 μm TrxR was used.
FIGURE 3.
FIGURE 3.
Efficiency of DTT, Trx1, and Grx1 for reduction of mouse RNR. A, enzyme activity of 74 μg/ml R1 plus 36 μg/ml R2 was measured in the presence of increasing amounts of DTT with standard assay conditions. B and C, samples with 120 μg/ml R1 and 40 μg/ml R2 were assayed with varying concentrations of Trx1, 1 mm NADPH, and 0.1 μm TrxR as the Trx system (B) or increasing amounts of Grx1, 1 mm NADPH, 4 mm GSH, and 0.1 μm GR as the Grx system (C).
FIGURE 4.
FIGURE 4.
Contribution of Trx with Grx system in RNR assay. Samples with 120 μg/ml R1 and 40 μg/ml R2 were assayed with different reductants as indicated in each column. The Grx system contained 1 μm Grx1, 4 mm GSH plus NADPH, and GR. As the Trx system 3.6 μm Trx1 with NADPH and TrxR were used. Combination of 3.6 μm Trx1 or the whole Trx system to the Grx system was checked. The results are expressed as the means ± S.E. of two independent experiments performed in duplicates.
FIGURE 5.
FIGURE 5.
Trx1 can reduce disulfide bonds with high amount of GSH and GR. A, using insulin as the substrate for Trx1, the effect of 4 and 10 mm GSH on the reduction of disulfides with 10 μm Trx1 was investigated after adding 0.1 μm GR. The consumption of NADPH was measured at A340. The rate of oxidation without Trx1 was subtracted from each point. B, this experiment was performed with 10 mm GSH and different concentrations of Trx1; precipitation of insulin at A650 was monitored after adding 0.1 μm GR.
FIGURE 6.
FIGURE 6.
Requirement of GSH for reduction of RNR with Grx. A, assay mixture contained 120 μg/ml R1, 40 μg/ml R2, and 0.4 mm DTT as ultimate reducing power. RNR activity with different concentrations of Trx1 (•) or Grx1 (○) was measured. The background activity of RNR with this amount of DTT was subtracted from each point. B, two series of samples with 74 μg/ml R1 and 36 μg/ml R2, and increasing concentrations of GSH were prepared; the reaction was started by adding reaction mixture supplemented with 1 μm Grx1, 1 mm NADPH, and 0.1 μm GR (□). Each point represents the mean value of two independent experiments with duplicate samples. The inset shows Lineweaver-Burk plot. In the second series (▪) standard reaction mixture was used to detect the background activity with different amounts of GSH. C, enzyme activity of 74 μg/ml R1 and 36 μg/ml R2 versus different concentrations of Grx1 is shown. Utilizing 4 mm (○) or 10 mm (•) GSH plus 1 mm NADPH and 0.1 μm GR were compared.
FIGURE 7.
FIGURE 7.
Cell extract as source of heat stable electron donors for RNR. The columns show the activity of 120 μg/ml R1 plus 40 μg/ml R2 with 5 μg heat-treated cell extract. The enzyme activity with the addition of 0.1 μm TrxR and 3 mm NADPH (black bar) or 4 mm GSH, 3 mm NADPH, and 0.1 μm GR (white bar) were compared. Each column represents the average of two independent assays with duplication. The count with 1 mm DTT (gray bar) was plotted after subtracting the background activity of recombinant RNR with 1 mm DTT as a control.
FIGURE 8.
FIGURE 8.
A, schematic model of mouse RNR with two pairs of redox active cysteines on the active site and C-terminal tail of R1, and the tyrosyl radical on R2 subunit. B, sequence alignment of the C-terminal region of the R1 subunit from different species. C, a model showing the dithiol and monothiol reduction pathways of mammalian RNR.

Similar articles

Cited by

References

    1. Nordlund, P., and Reichard, P. (2006) Annu. Rev. Biochem. 75 681–706 - PubMed
    1. Kolberg, M., Strand, K. R., Graff, P., and Andersson, K. K. (2004) Biochim. Biophys. Acta 1699 1–34 - PubMed
    1. Reichard, P. (2002) Arch. Biochem. Biophys. 397 149–155 - PubMed
    1. Kashlan, O. B., Scott, C. P., Lear, J. D., and Cooperman, B. S. (2002) Biochemistry 41 462–474 - PubMed
    1. Rofougaran, R., Vodnala, M., and Hofer, A. (2006) J. Biol. Chem. 281 27705–27711 - PubMed

Publication types

MeSH terms