. 2009 Apr;19(4):682-9.
doi: 10.1101/gr.081778.108. Epub 2009 Jan 28.

Multiple whole-genome alignments without a reference organism

Affiliations

Multiple whole-genome alignments without a reference organism

Inna Dubchak et al. Genome Res. 2009 Apr.

Abstract

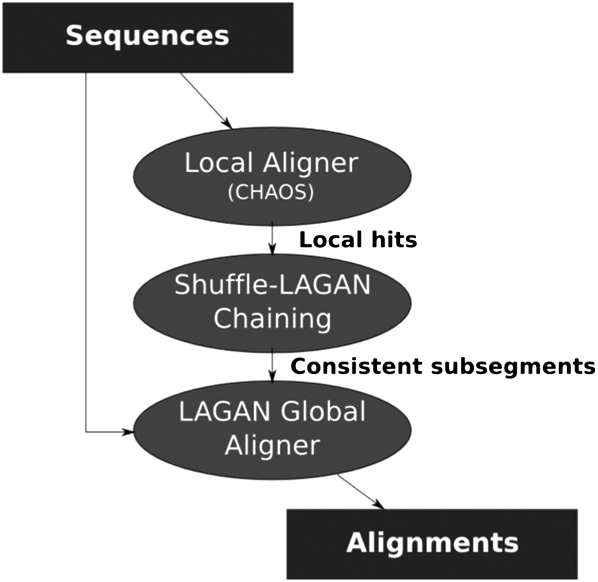
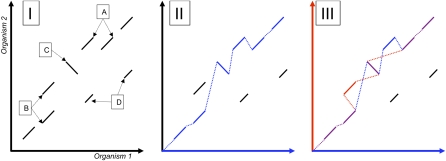
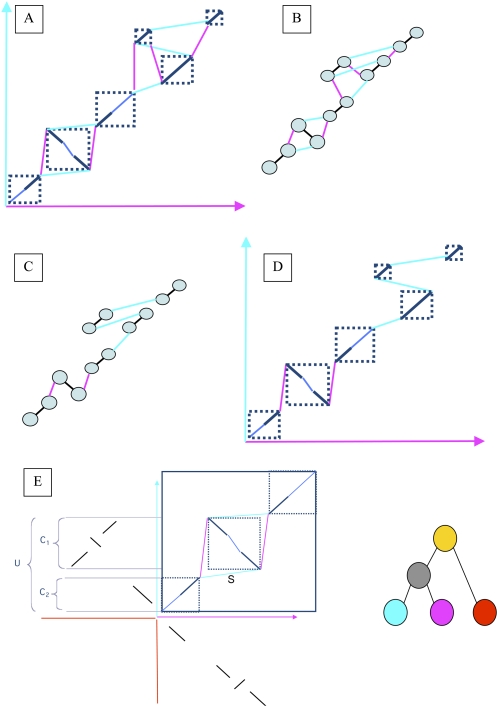
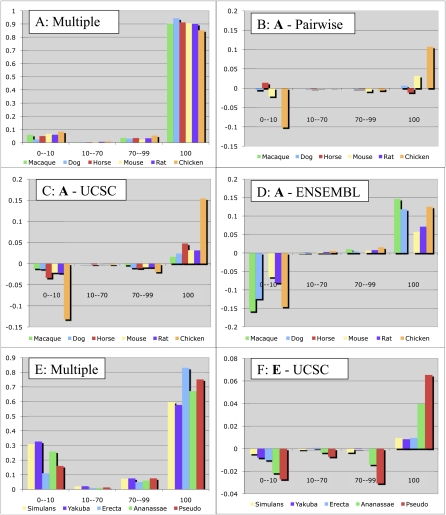
Multiple sequence alignments have become one of the most commonly used resources in genomics research. Most algorithms for multiple alignment of whole genomes rely either on a reference genome, against which all of the other sequences are laid out, or require a one-to-one mapping between the nucleotides of the genomes, preventing the alignment of recently duplicated regions. Both approaches have drawbacks for whole-genome comparisons. In this paper we present a novel symmetric alignment algorithm. The resulting alignments not only represent all of the genomes equally well, but also include all relevant duplications that occurred since the divergence from the last common ancestor. Our algorithm, implemented as a part of the VISTA Genome Pipeline (VGP), was used to align seven vertebrate and six Drosophila genomes. The resulting whole-genome alignments demonstrate a higher sensitivity and specificity than the pairwise alignments previously available through the VGP and have higher exon alignment accuracy than comparable public whole-genome alignments. Of the multiple alignment methods tested, ours performed the best at aligning genes from multigene families-perhaps the most challenging test for whole-genome alignments. Our whole-genome multiple alignments are available through the VISTA Browser at http://genome.lbl.gov/vista/index.shtml.


Figures

Figure 1.
Figure 1.
Overview of the Shuffle-LAGAN algorithm. S-LAGAN first locates all local areas of similarity between the two sequences using a local alignment algorithm. A subset of these is selected using the 1-monotonic chaining algorithm (Fig. 2). Finally, global alignments are built (using LAGAN) for consistent subsegments of the 1-monotonic chain (areas without rearrangements). The S-LAGAN algorithm is not symmetric, requiring two alignments to identify all duplications.
Figure 2.
Figure 2.
SuperMap Algorithm. The left side (I) is a dotplot demonstrating the local alignments between two hypothetical genomes. Local alignments A and B correspond to duplications in Organism 1 and Organism 2, respectively. Local alignment C corresponds to an inversion, and local alignments D are spurious false positives. The middle panel (II) shows (in blue) the result of running the regular S-LAGAN 1-monotonic chaining algorithm using Organism 1 as the base. On the right (III) we have built the 1-monotonic maps for Organism 1 (blue) and 2 (red). Whenever these chains merge, they are shown as purple. Similarly, local alignments are colored based on which chains they belong to blue (M1), red (M2), or purple (both, DM). All points where the two chains split or join are borders of a region of conserved synteny.
Figure 3.
Figure 3.
A schematic representation of the reconstruction of ancestral orderings. (A) The result of running SuperMap on a set of local alignments. (B) The corresponding graph representation, with alignment edges colored black, and connection edges colored by the color of the genome in which these syntenic blocks are adjacent. The weight of all of the edges is computed as shown in E. (C) The output of running the maximum matching algorithm: Each node is connected to only one connection edge, as well as the alignment edge. Note that by removing the alignment edges this graph is decomposed into two connected components, which can be solved separately. (D) The translation of the maximum matching output back to the alignments: The result of the algorithm is a chain of alignments, where the letters of the appropriate genome can be inserted between the sequences. These chains can then be used for alignment in higher nodes of the tree. (E) In this example we are recreating the ancestral order of the gray node in the phylogeny on the right. The top right quadrant shows the output of the SuperMap algorithm applied to the blue and purple genomes. The top left and bottom right quadrants show the local hits of the two genomes on the red outgroup. The selected regions on the left are used to compute the score for the blue edge marked S (S = (U − MIN(C 1 ,C 2))/MAX(C 1 ,C 2)). All of the other edges will be scored the same way, and the MWPM problem is solved in the resulting graph. In this particular case the purple genome will have more support for being the ancestral order than the blue genome.
Figure 4.
Figure 4.
Exon alignment accuracy for vertebrate (A–D) and Drosophila (E,F) genomes. Each category on the X-axis shows the exons for a particular species that are aligned to a reference genome exon over the given fraction of their length. The Y-axis for A and E shows the overall fraction of exons in each category for our alignments, while the other plots show the difference of these fractions between our multiple alignments and those from the UCSC Genome Browser (ours minus UCSC, C and F), those from the Ensembl browser (D), and our pairwise alignments (B). Our algorithms align more exons perfectly (100% category) and fewer exons are not aligned at all (0–10 category) for all species. In the comparison between our multiple and our pairwise alignments, while the macaque alignments are identical, and the dog alignments are nearly identical (the two species are close), the human/mouse alignment is slightly improved, and nearly 10% of chicken exons were aligned in the multiple but not pairwise alignment. The 23-way Ensembl alignments that we used had a different version of the horse genome, preventing a direct comparison, and we did not generate a pairwise human/rat alignment (rat would be very similar to mouse), hence the missing columns in B and D.

References

    1. Abbasi A.A., Paparidis Z., Malik S., Goode D.K., Callaway H., Elgar G., Grzeschik K.H. Human GLI3 intragenic conserved non-coding sequences are tissue-specific enhancers. PLoS One. 2007;2:e366. doi: 10.1371/journal.pone.0000366. - DOI - PMC - PubMed
    1. Batzoglou S., Pachter L., Mesirov J.P., Berger B., Lander E.S. Human and mouse gene structure: Comparative analysis and application to exon prediction. Genome Res. 2000;10:950–958. - PMC - PubMed
    1. Bejerano G., Pheasant M., Makunin I., Stephen S., Kent W.J., Mattick J.S., Haussler D. Ultraconserved elements in the human genome. Science. 2004;304:1321–1325. - PubMed
    1. Blanchette M., Kent W.J., Riemer C., Elnitski L., Smit A.F., Roskin K.M., Baertsch R., Rosenbloom K., Clawson H., Green E.D., et al. Aligning multiple genomic sequences with the threaded blockset aligner. Genome Res. 2004;14:708–715. - PMC - PubMed
    1. Bray N., Pachter L. MAVID: Constrained ancestral alignment of multiple sequences. Genome Res. 2004;14:693–699. - PMC - PubMed

Publication types