

The costs and benefits of automatic estimated glomerular filtration rate reporting
- PMID: 19176794
- PMCID: PMC2637597
- DOI: 10.2215/CJN.04080808
The costs and benefits of automatic estimated glomerular filtration rate reporting
Abstract
Background and objectives: The prevalence of chronic kidney disease (CKD) has increased over the past two decades. The sensitivity of serum creatinine (sCr) to identify CKD is low. As a result, many healthcare centers report estimated GFR (eGFR) with routine blood work. The aim of this study was to determine the cost-effectiveness of automatic eGFR reporting compared with reporting sCr alone.
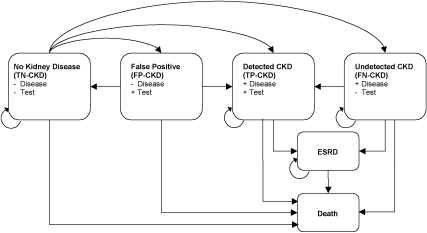
Design, setting, participants, & measurements: A Markov model was designed to evaluate the cost-effectiveness of reporting eGFR compared with reporting sCr alone in a hypothetical cohort of 60-yr-old individuals undergoing annual blood chemistry testing over 18 yr. Paths and path probabilities were identical between the two arms, except for the sensitivity and specificity of eGFR and sCr to detect CKD.
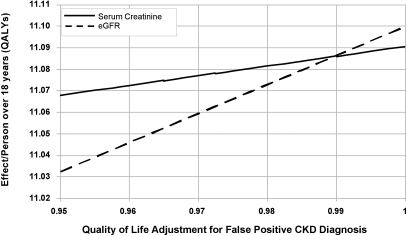
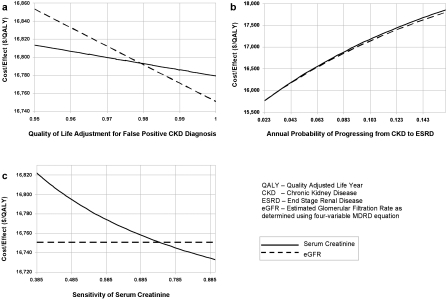
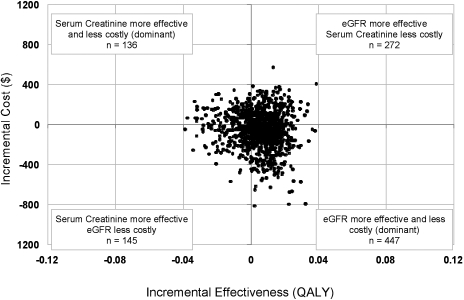
Results: eGFR reporting was dominant with a cost/effectiveness ratio of $16,751/quality-adjusted life year (QALY) versus $16,779/QALY for sCr reporting. Monte Carlo microsimulations in a hypothetical cohort of 10,000 patients demonstrated that over 18 yr, an average of 13 fewer deaths, 29 fewer ESRD events, and 11,348 more false positive CKD (FP-CKD) cases occurred with eGFR reporting. A sensitivity analysis revealed that decreasing the FP-CKD quality of life by > 2% rendered sCr reporting more cost-effective than eGFR reporting. If FP-CKD reduced quality of life by 5%, the incremental cost-effectiveness ratio for sCr reporting versus eGFR reporting would be $4367/QALY.
Conclusion: A decision analysis suggests that reporting eGFR may be beneficial, but this limited benefit was reversed with virtually any reduction in quality of life caused by incorrect diagnosis of CKD.
Figures
References
-
- Coresh J, Selvin E, Stevens LA, Manzi J, Kusek JW, Eggers P, Van Lente F, Levey AS: Prevalence of chronic kidney disease in the United States. JAMA 298: 2038–2047, 2007 - PubMed
-
- Coresh J, Byrd-Holt D, Astor BC, Briggs JP, Eggers PW, Lacher DA, Hostetter TH: Chronic kidney disease awareness, prevalence, and trends among U.S. adults, 1999 to 2000. J Am Soc Nephrol 16: 180–188, 2005 - PubMed
-
- Go AS, Chertow GM, Fan D, McCulloch CE, Hsu CY: Chronic kidney disease and the risks of death, cardiovascular events, and hospitalization. N Engl J Med 351: 1296–1305, 2004 - PubMed
-
- Menon V, Wang X, Sarnak MJ, Hunsicker LH, Madero M, Beck GJ, Collins AJ, Kusek JW, Levey AS, Greene T: Long-term outcomes in nondiabetic chronic kidney disease. Kidney Int 73: 1310–1315, 2008 - PubMed
-
- Duncan L, Heathcote J, Djurdjev O, Levin A: Screening for renal disease using serum creatinine: Who are we missing? Nephrol Dial Transplant 16: 1042–1046, 2001 - PubMed
Publication types
MeSH terms
Substances
LinkOut - more resources
Full Text Sources
Medical
Research Materials
Miscellaneous
