. 2009 Jan 28;29(4):1017-33.
doi: 10.1523/JNEUROSCI.5528-08.2009.

Synaptopodin regulates plasticity of dendritic spines in hippocampal neurons

Affiliations

Synaptopodin regulates plasticity of dendritic spines in hippocampal neurons

Andreas Vlachos et al. J Neurosci. .

Abstract

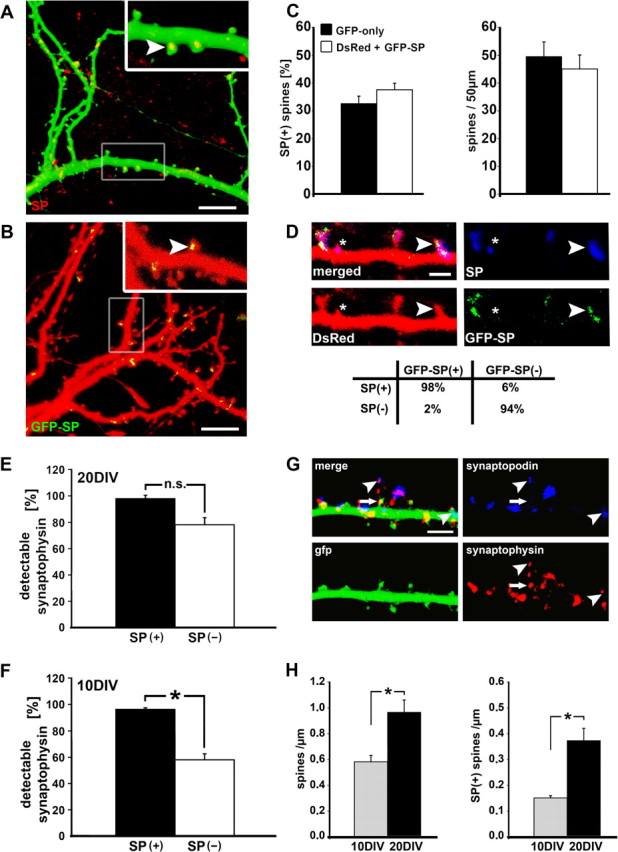
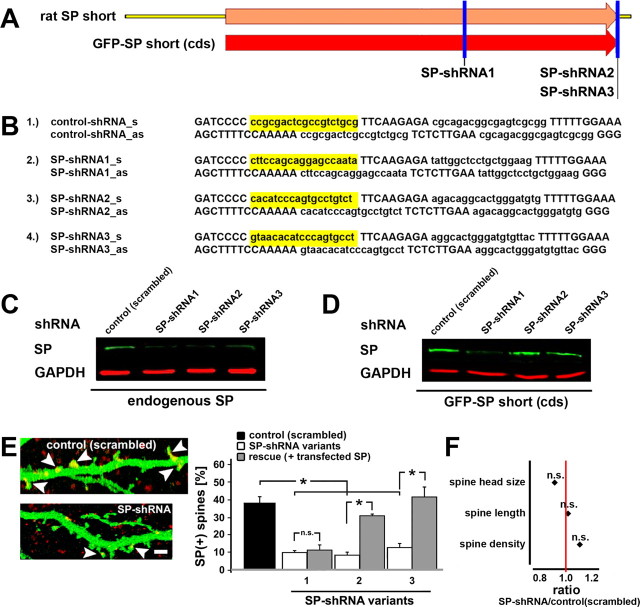
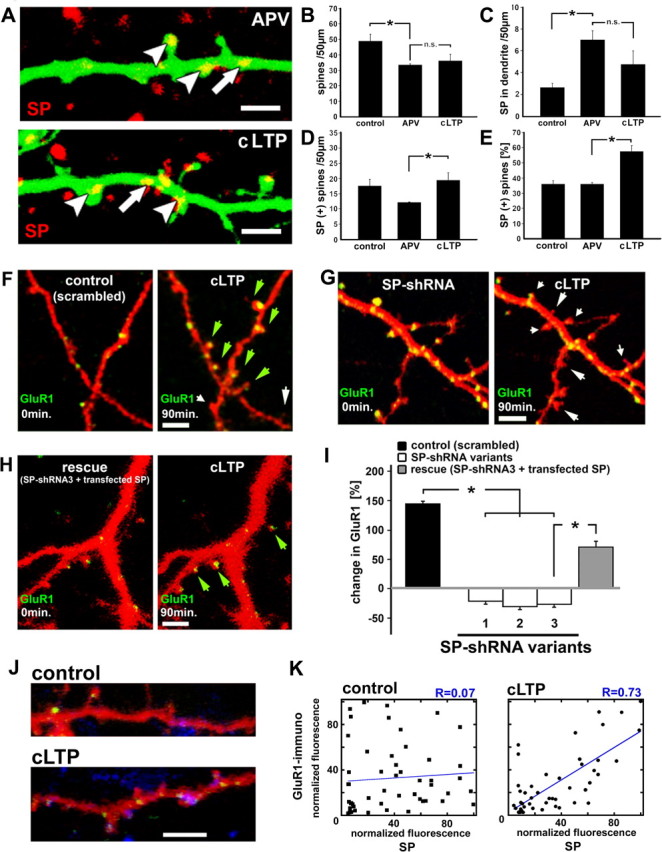
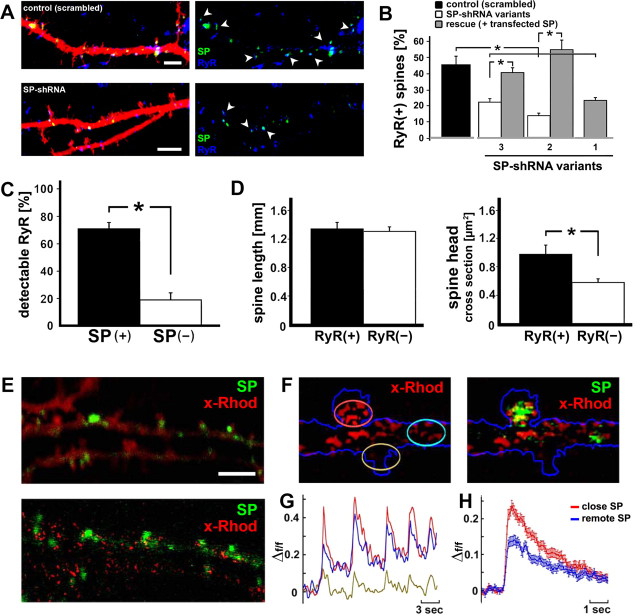
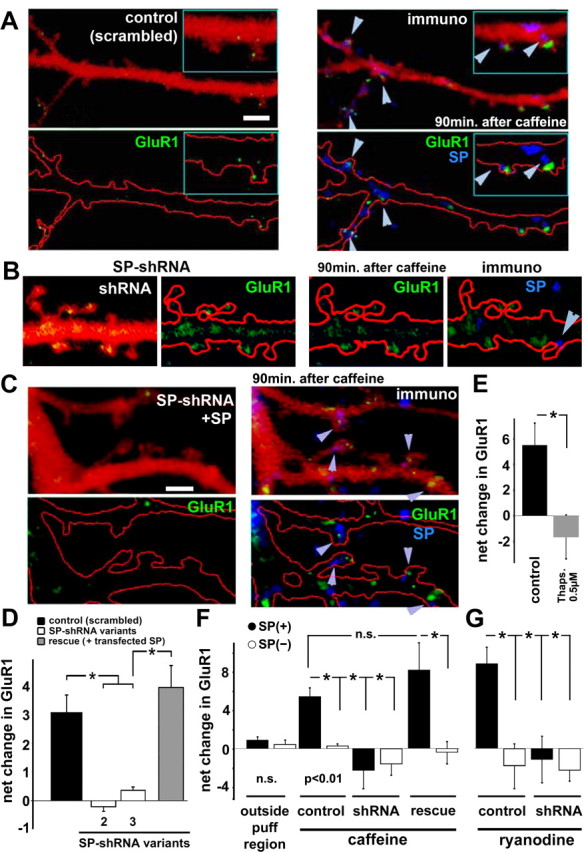
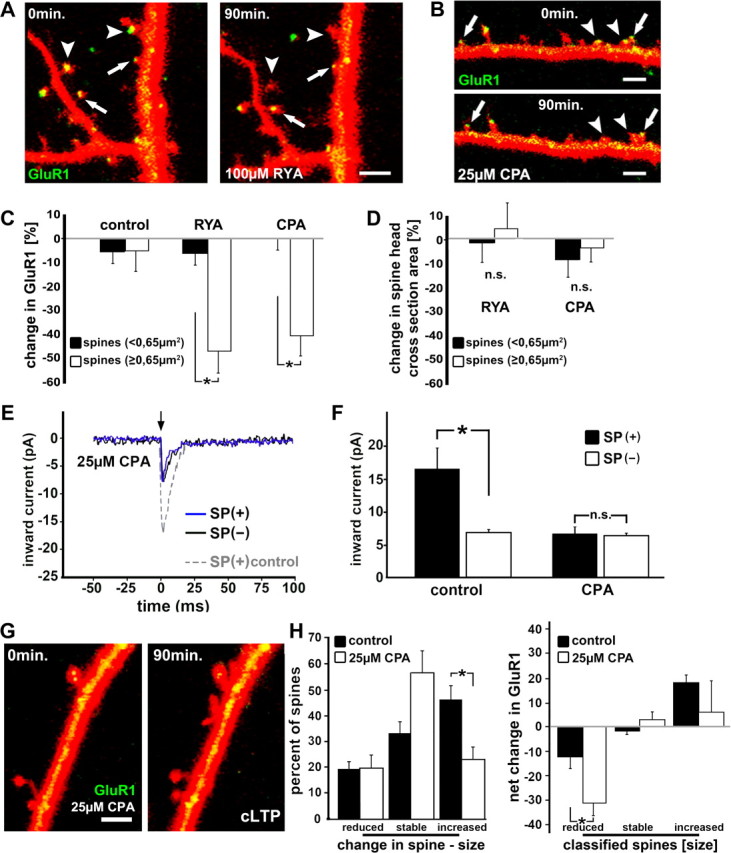
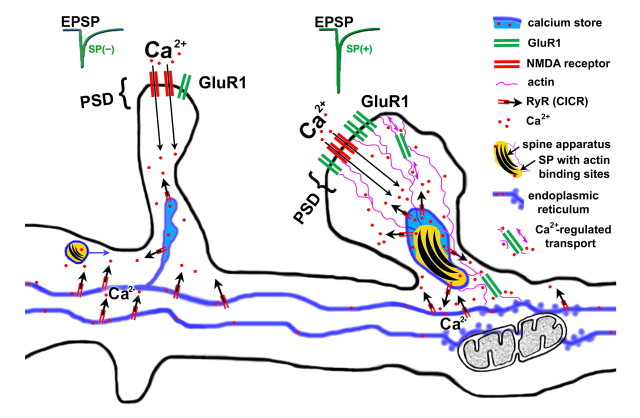
The spine apparatus is an essential component of dendritic spines of cortical and hippocampal neurons, yet its functions are still enigmatic. Synaptopodin (SP), an actin-binding protein, is tightly associated with the spine apparatus and it may play a role in synaptic plasticity, but it has not yet been linked mechanistically to synaptic functions. We studied endogenous and transfected SP in dendritic spines of cultured hippocampal neurons and found that spines containing SP generate larger responses to flash photolysis of caged glutamate than SP-negative ones. An NMDA-receptor-mediated chemical long-term potentiation caused the accumulation of GFP-GluR1 in spine heads of control but not of shRNA-transfected, SP-deficient neurons. SP is linked to calcium stores, because their pharmacological blockade eliminated SP-related enhancement of glutamate responses, and release of calcium from stores produced an SP-dependent increase of GluR1 in spines. Thus, SP plays a crucial role in the calcium store-associated ability of neurons to undergo long-term plasticity.


Figures

Figure 1.
Figure 1.
Distribution of synaptopodin (SP) puncta in dendritic spines of cultured hippocampal neurons. A, The position of SP (arrowhead) is indicated in 20 DIV cultured hippocampal neurons transfected with GFP (green) for visualizing the morphology and immunostained for native SP (red). A punctate pattern can be observed in which SP is mainly associated with the spine neck, but also with the head and base of spines. Scale bar, 10 μm. B, A similar distribution is seen in neurons cotransfected with DsRed and GFP-SP. Scale bar, 10 μm. C, Neither spine density nor the proportion of SP-positive spines is different between the two groups (GFP-only: n = 4 cultures, 16 segment, 778 spines; DsRed and GFP-SP: n = 3 cultures, 12 segments, 509 spines). D, In 98% of spines positive for GFP-SP, there was also immunostaining for SP, and 94% of cases spines negative for GFP-SP were also negative when immunostained for SP. This indicates that the distribution of GFP-SP matches the expression of endogenous SP (n = 3 cultures, 9 segments, 352 spines). Scale bar, 1 μm. E, In mature cultures (20 DIV), the vast majority of spines are associated with the presynaptic marker synaptophysin (88 ± 6.3%). There was no significant difference (NS) between SP(+) and SP(−) spines at 20 DIV (p > 0.061; n = 5 cultures, 20 segments, 1061 spines). F, In younger cultures (10 DIV), fewer SP(−) spines were adjacent to synaptophysin puncta (59.1 ± 4.5%) compared with SP(+) spines, which still demonstrated the same probability to be associated with synaptophysin (95 ± 1.9%, p < 0.001; n = 4 cultures, 16 segments, 820 spines). G, Double immunostaining for SP (blue) and synaptophysin (red) in GFP-transfected cells (green) at 20 DIV. Arrowheads point at areas where SP is associated with synaptophysin. The arrow highlights an SP(−) spine in association with synaptophysin. Scale bar, 5 μm. H, While cultures mature, an increase in spine density (p < 0.001) is accompanied by more SP(+) spines (p < 0.001). These results indicate that SP is associated with mature spines. Data are represented in this and the following figures as the mean ± SEM.
Figure 2.
Figure 2.
Distribution of SP puncta is correlated with changes in spine head size. A, Illustrations of immunostained endogenous SP (blue) and transfected SP puncta (green) in dendrites and spines of DsRed-labeled neurons (red). Scale bars, 5 μm. Bottom, silhouette frame of the dendrite and spines to clarify the view of the staining. B, For both GFP-SP-transfected (right) and endogenous (left) SP-containing spines, no significant difference in spine length was observed; p > 0.82 (left) and p > 0.23 (right). C, Maximum cross-sectional area of the spine head is twice as large in the SP(+) spines as in the SP(−) spines; p < 0.001. D, Time-lapse imaging of individual segments over a period of 3 d (19–22 DIV) demonstrates the dynamics of individual SP clusters entering (arrow) and leaving (arrowhead) dendritic spines. SP can change its position within individual spines. A case of SP dropping into the dendrite is highlighted with an asterisk. Scale bar, 5 μm. The boxed area is shown at higher magnification on the right. Scale bar, 2 μm. E, Analysis of changes in spine head size over time in spines losing or gaining SP reveals that SP is associated with changes in spine head size (n = 5 cultures, p < 0.002) (see also movie, available at www.jneurosci.org as supplemental material).
Figure 3.
Figure 3.
The presence of SP in spines correlates with the quantity and efficacy of glutamate receptors (GluR) of the AMPA type, but not of the NMDA type. A, B, Immunostaining for GluR1 clusters demonstrates a higher mean fluorescent intensity in SP(+) spines (arrows) compared with SP(−) spines (arrowhead) (50.6 ± 4.2 and 34.2 ± 2.1 fluorescence intensity units, respectively; n = 4 cultures, 9 segments, 295 spines; p < 0.05). Scale bar, 1 μm. C, Uncaging of glutamate applied near the head of individual spines (circles) that are positive for transfected GFP-SP (yellow in colocalization with the DsRed signal) produces a larger amplitude of inward current compared with SP(−) spines. The 3D reconstruction demonstrates the subcellular localization of SP. The inset illustrates the 2D projection of the original confocal image stack. Scale bar, 5 μm. Traces of inward current, generated at the flash (arrow) demonstrate the difference between SP(+) (blue trace) and SP(−) spines. D, SP(+) spines show a 2.5-fold larger amplitude of inward current when compared with spines lacking SP (p < 0.02; n = 6 cultures; 7 cell, 47 SP(+) spines, 44 SP(−) spines). Spine size was not different in the two groups as determined by measuring the maximum cross-sectional area and spine length (p > 0.674 and 0.238, respectively). E, Current responses evoked by uncaging of glutamate near the head of a SP(+) spine, with the cell membrane held at different membrane potentials from −80 to +40 mV. The emergence of a slow component at the depolarizing potentials is evident. F, Current-voltage relations for the fast component, peaking at 2–3 ms after the flash, and for the slow component, peaking at 200 ms after the flash, and representing the NMDA component of the response to glutamate. G, An illustration of the response of a cell to flash photolysis of caged glutamate near a spine, recorded in the presence of 50 μm APV, with the cell held at −60 and +50 mV. The slow component of the response is completely blocked. H, Sample illustrations of responses of cells held at −60 and +50 mV to flash photolysis of caged glutamate near an SP(+) and an SP(−) spine, illustrating a “silent synapse.” I, J, Group data [n = 19 SP(+) spines and 17 SP(−) spines] in three different experiments (n = 5 cells, paired recording), demonstrating a significant difference when recorded at resting potential (J) and a lack of difference when recorded at +50 mV.
Figure 4.
Figure 4.
SP-shRNAs reduce expression of endogenous and transfected SP in PC12 cells and hippocampal neurons. A, B, For knocking down SP expression, three different shRNA sequences containing 19 nt corresponding to the rat synaptopodin gene were cloned into the pSUPER vector. One shRNA (variant 1) was targeting to the cds, the other two shRNAs (variant 2 and 3) were targeting 3′ untranslated regions (3′-UTRs) of rat synaptopodin. For control, a 19 nt scrambled sequence with no significant homology to any other mammalian gene was used. C, All constructed shRNAs significantly reduced endogenous SP expression in PC12 cells as demonstrated by Western blot analysis. D, shRNA variant 1 was also effective in reducing transfected SP (expressing cds only), whereas the 3′UTR-shRNAs (variants 2 and 3) did not affect cotransfected SP. E, Similar results could be obtained in hippocampal neurons. All transfected shRNAs significantly reduced the number of SP(+) spines [p < 0.001; arrowhead point to SP(+) spines]. The attempt to rescue the effects of shRNAs with cotransfected SP demonstrated results comparable to those seen in PC12 cells; only shRNA variant 1 could not be rescued by cotransfected SP (p = 0.36). Scale bar, 2 μm. F, Spine head size (p > 0.31), spine length (p > 0.78), and spine density (p > 0.7) were not different [n = 10 cells transfected with a scrambled control sequence, n = 31 shRNA-transfected cells, n = 11 cells cotransfected with SP(cds)].
Figure 5.
Figure 5.
SP shRNA-transfected neurons demonstrate reduced accumulation of GluR1-clusters in spine heads after the induction of LTP. A–E, A transient activation of synaptic NMDA-Rs (cLTP) causes an increase in the number of SP(+) spines within 90 min (untreated controls: n = 4 cultures, 16 segments, 778 spines; APV: n = 4 cultures, 16 segments, 531 spines; cLTP: n = 3 cultures, 12 segments, 353 spines). Arrowheads point at SP(+) spines, and the arrows highlight endogenous SP in the dendrite. Scale bar, 2 μm. B–E, In APV-treated cultures, a decrease in spine density (B; p < 0.001) is accompanied by more SP puncta located in the dendrite compared with control cultures (C; p < 0.001). LTP causes a significant increase in the number of SP(+) spines (D, E; p < 0.04), although changes in spine density are negligible (B; p > 0.31). SP in the dendrite is not reduced back to control levels after the induction of LTP (C). F–I, Effects of cLTP on dendritic spines and GluR1 clusters are illustrated for neurons transfected with (F) a scrambled control vector, (G) shRNA for SP, and (H) with a 3′UTR-shRNA and SP (for rescue), before (left) and 90 min after (right) cLTP induction (GFP-GluR1 is yellow when colocalized with DsRed). Green arrows indicate the formation of new spines with a GluR1 cluster, white arrows indicate shrinkage or disappearance of spines, and short arrows indicate disappearance of GluR1 clusters. Scale bars, 2 μm. I, Changes in fluorescence intensity of GFP-GluR1 clusters in individual spine heads were measured in four control neurons (transfected with the scrambled plasmid), in 15 shRNA-transfected neurons (n = 5 cells per group), and in 4 neurons transfected with 3′UTR-shRNA and SP (one cell per glass). There was a marked increase in GluR1 fluorescence after the conditioning protocol. In contrast, the shRNA-transfected neurons demonstrated a decrease in GluR1 fluorescence 90 min after cLTP induction. Remarkably, in the group of neurons transfected with 3′UTR-shRNA and SP, GluR1 fluorescence was back to scrambled control levels, which were significantly different from the levels in shRNA-transfected cells. J, Colocalization of SP-transfected (green) and GluR1-immunoreactive (blue) dendrites in control (top) and LTP-treated culture (bottom). Scale bar, 3 μm. K, Summary of quantification of colocalized GluR1-immunoreactive and SP-fluorescent puncta in control (n = 5 cells, 50 spines) and cLTP-treated neurons (n = 6 cells, 50 spines), demonstrating the lack of correlation in the control, and a highly significant (r = 0.73, p < 0.01) correlation between SP fluorescence and GluR1.
Figure 6.
Figure 6.
SP is coupled to ryanodine receptors (RyR). A, Association between SP (green) and RyR (blue) in DsRed-transfected neurons. Both signals were frequently found adjacent to and touching each other within the same spines (see also supplemental Fig. 1, available at www.jneurosci.org as supplemental material). Arrowheads point at SP(+) spines. Scale bars, 2 μm. B, SP-shRNA-transfected neurons express fewer spine-associated RyR compared with cells transfected with a scrambled RNA plasmid (n = 3 cells per group; p < 0.001). The effects of shRNA variant 1, targeting the coding sequence of SP, cannot be rescued with cotransfected SP (cds only). C, D, RyR are more prevalent in SP(+) than in SP(−) spines (n = 6 cells, 101 spines; p < 0.01). D, No difference in spine length between RyR-positive [RyR(+)] and RyR-negative [RyR(−)] spines was seen (p > 0.895). The presence of RyR was associated with a larger spine head size (p < 0.02). E–H, Pulsed application of caffeine caused a transient rise of [Ca2+]i, nearer to SP puncta than more remote from them. Red indicates x-Rhod staining for imaging of [Ca2+]i, green GFP-SP. E, Raw image (top) and a subtracted image (bottom), indicating loci where x-Rhod shows enhanced fluorescence after exposure to caffeine. F, Regions of interest drawn near and remote from SP puncta. G, Illustration of responses to five consecutive pulse applications of caffeine; the individual traces correspond in color to those circled in F. H, Summary diagram of the time course of calcium changes near and remote from SP puncta in 48 dendrite/spine segments. The difference between the groups is highly significant (p < 0.001). These results demonstrate that SP is correlated with a larger calcium transient in response to caffeine.
Figure 7.
Figure 7.
Caffeine causes accumulation of GluR1 in spines via SP-associated calcium surges. Pulsed application of caffeine caused a rise of GluR1 fluorescence in spines of control (transfected with a scrambled shRNA sequence) but not in shRNA-transfected neurons. A–C, Shown are dendrites of cells transfected with DsRed for imaging morphology. Red outline is drawn to ease identification of the puncta. Before (left) and 90 min after (right) the pulsed application of caffeine, immunostained for SP to indicate that the same spines that demonstrated an increase in florescence intensity of GluR1 puncta (green arrowheads) are also endowed with SP (blue). Scale bar, 2 μm. B, Same as A, but in a cell transfected with shRNA for SP. An actual reduction in the fluorescent intensity of GluR1 puncta is evident. C, Same as A, except that the cell was transfected with a 3′-UTR shRNA and with SP, in an attempt to rescue the effects of shRNAs on the accumulation of GluR1 in spines. D, Summary diagram of the changes in GluR1 fluorescence (in arbitrary units) before and after exposure to caffeine. Highly significant differences are seen between scrambled controls and shRNA-transfected neurons (p < 0.0002; n = 5 cells in the scrambled control group, n = 4 cells each in the other three groups, 27 spines in each group). E, The net increase in GluR1 fluorescence following exposure to caffeine was blocked by the presence of thapsigargin in the imaging medium (3 cells, 20 spines per group, p < 0.006). F, A subset of cultures was fixed and immunostained post hoc for SP. The analysis was made separately for SP(+) and SP(−) spines [each group contains at least 12 spines, except for the shRNA group, which only contained 4 SP(+) spines]. The results clearly indicated that the caffeine-induced rise in GluR1 fluorescence was restricted to SP(+) spines. G, Pulse application of 5 μm ryanodine, as with caffeine, could produce an SP(+)-selective rise in GluR1 fluorescence, and this too, was absent in shRNA-transfected neurons [control SP(+), 10 spines; SP(−), 15 spines, 2 cells; shRNA, 9 SP(+), 18 SP(−), 3 cells].
Figure 8.
Figure 8.
SP recruits RyR containing calcium stores to regulate GluR1 in dendritic spines. A, B, The density of GFP-GluR1 in DsRed-transfected cells is reduced after 90 min of exposure to 100 μm ryanodine or 25 μm CPA in spines with large heads (arrowheads) but not in spines with smaller heads (arrows), respectively. Scale bar, 1 μm. C, D, Summary diagram demonstrating the reduction of GFP-GluR1 fluorescent intensity in big spines in the presence of ryanodine or CPA (n = 5 cultures per group, five segments, one cell per culture; p < 0.01). Spine head size was not altered after 90 min in ryanodine or CPA (p > 0.2). E, Trace illustrations of inward current, generated at the flash (arrow; glutamate uncaging) demonstrate responses of SP(+) (blue trace) and SP(−) spines after 90 min of treatment with 25 μm CPA. Note the larger responses of an SP(+) spine under control conditions (gray dotted trace). F, The responses to the uncaging of glutamate in SP(+) spines is reduced down to the level seen in SP(−) spines after treatment with CPA (n = 4 cultures; four cells; 30 SP(+) spines; 26 SP(−) spines; four consecutive responses averaged per spine). G, H, The cLTP induction protocol was applied in CPA-treated cultures (25 μm) cotransfected with GFP-GluR1 and DsRed. Scale bar, 1 μm. Changes in spine size as well as changes in GluR1 fluorescence were compared before and 90 min after the induction of LTP. CPA-treated neurons (n = 4 cell, 180 spines) did not express a rise in GluR1 after the induction of LTP (p > 0.39), and significantly fewer spines were expanded after the induction of cLTP (H; p < 0.005).
Figure 9.
Figure 9.
Integrity of F-actin is critical for SP-mediated caffeine-induced increase in GluR1 in spine. A, Latrunculin causes a large reduction in rhodamine-phalloidin staining of F-actin. Top, Control neuron transfected with GFP for imaging morphology, and stained with phalloidin, which labels primarily dendritic spines. Bottom, 2 h of exposure to latrunculin produced a highly significant reduction in phalloidin staining (bar graph below, averages of 50 spines sampled from five cells each). Scale bar, 5 μm. B, In the same dendritic segment, transfected with GFP-SP and DsRed for morphology, imaged before (top) and after (bottom) 2.5 h of exposure to latrunculin A (20 μm). Green arrowheads point to persistent spines; white arrowheads point to modified (removed, elongated) spines. C, Summary diagram of the proportion of persistence among SP(+) and SP(−) spines, indicating a clear correlation between the persistence of spines and the presence of SP puncta. D, E, Latrunculin does not affect the ability of caffeine to induce a rise of [Ca2+]i in dendrites and spines. D, Consecutive responses of the same dendritic segment to a pulse application of caffeine applied before, 1.5 h, and 2 h after exposure to latrunculin. E, Averaged responses of five fields in two cells to caffeine, before and 2.5 h after the onset of exposure to latrunculin. F–H, Exposure of control (F) and latrunculin-treated (H) cultures to caffeine causes a change in GluR1 puncta, such that in the control there is a rise in spine GluR1 fluorescence (green arrowheads), while in the toxin-exposed culture the density of GluR1 was reduced significantly. In both F and H cultures, the three images were taken before (left), after 1.5 h of caffeine (middle), and in retrospective immunocytochemistry (immuno) for SP (blue arrowheads) (right). G, The difference between control and latrunculin-treated cultures was highly significant.
Figure 10.
Figure 10.
Schematic illustration summarizing the experimental data. Transient synaptic activation of NMDA-Rs causes an accumulation of SP in dendritic spines, an increase in spine head volume, and the accumulation of AMPA-Rs. SP regulates the presence of RyR in the spine neck. In turn, these receptors regulate calcium release from internal stores, which is a crucial step in postsynaptic spine plasticity.

Similar articles

Cited by

References

    1. Asanuma K, Kim K, Oh J, Giardino L, Chabanis S, Faul C, Reiser J, Mundel P. Synaptopodin regulates the actin-bundling activity of alpha-actinin in an isoform-specific manner. J Clin Invest. 2005;115:1188–1198. - PMC - PubMed
    1. Asanuma K, Yanagida-Asanuma E, Faul C, Tomino Y, Kim K, Mundel P. Synaptopodin orchestrates actin organization and cell motility via regulation of RhoA signalling. Nat Cell Biol. 2006;8:485–491. - PubMed
    1. Bas Orth C, Vlachos A, Del Turco D, Burbach GJ, Haas CA, Mundel P, Feng G, Frotscher M, Deller T. Lamina-specific distribution of synaptopodin, an actin-associated molecule essential for the spine apparatus, in identified principal cell dendrites of the mouse hippocampus. J Comp Neurol. 2005;487:227–239. - PubMed
    1. Boehm J, Kang MG, Johnson RC, Esteban J, Huganir RL, Malinow R. Synaptic incorporation of AMPA receptors during LTP is controlled by a PKC phosphorylation site on GluR1. Neuron. 2006;51:213–225. - PubMed
    1. Burgoyne RD, Barron J, Geisow MJ. Cytochemical localisation of calcium binding sites in adrenal chromaffin cells and their relation to secretion. Cell Tissue Res. 1983;229:207–217. - PubMed

Publication types

MeSH terms

LinkOut - more resources