. 2009 Jan 28;29(4):1105-14.
doi: 10.1523/JNEUROSCI.4604-08.2009.

Intracellular Zn2+ accumulation contributes to synaptic failure, mitochondrial depolarization, and cell death in an acute slice oxygen-glucose deprivation model of ischemia

Affiliations

Intracellular Zn2+ accumulation contributes to synaptic failure, mitochondrial depolarization, and cell death in an acute slice oxygen-glucose deprivation model of ischemia

Yuliya V Medvedeva et al. J Neurosci. .

Abstract

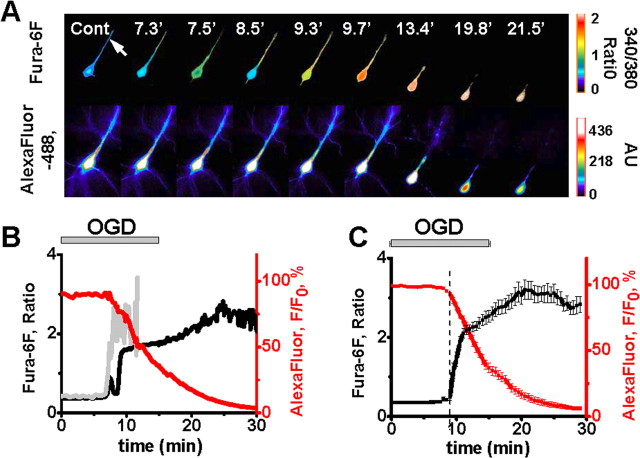
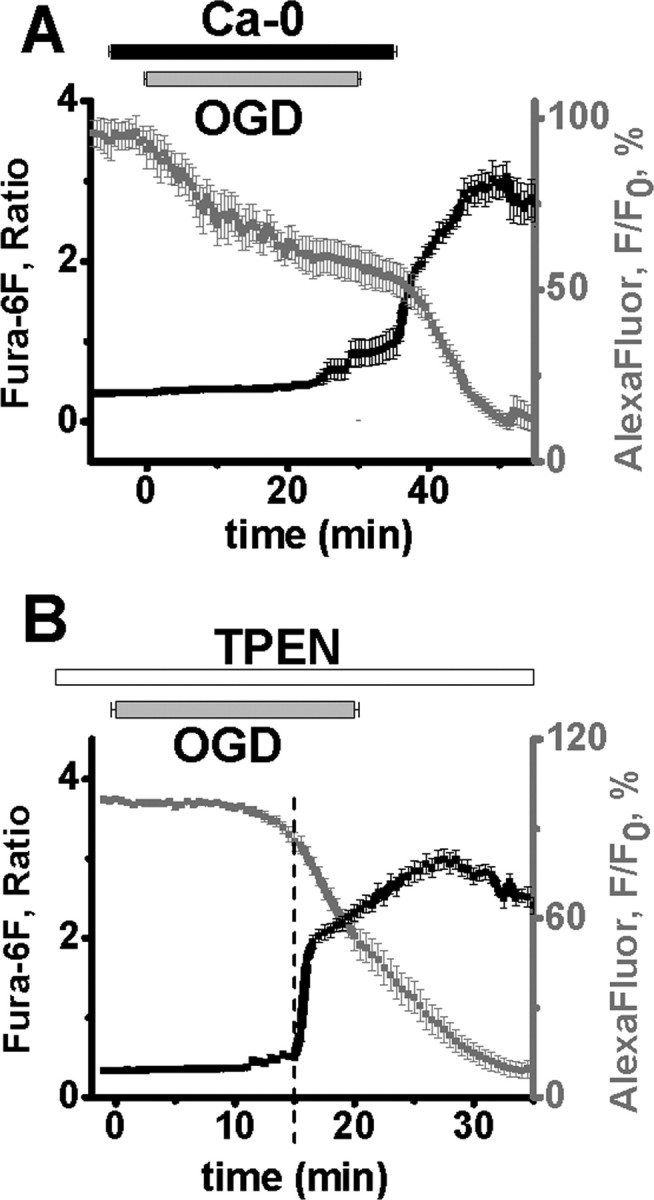
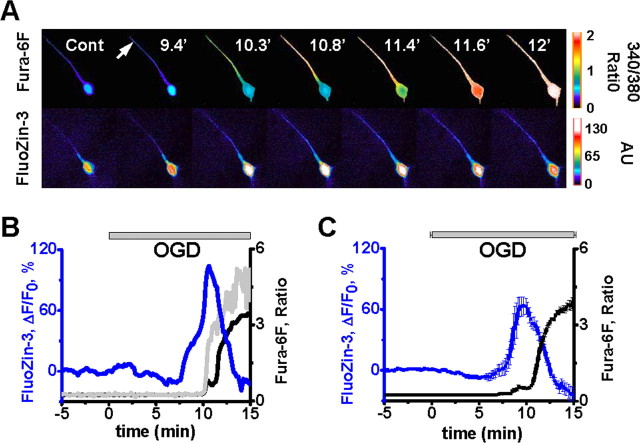
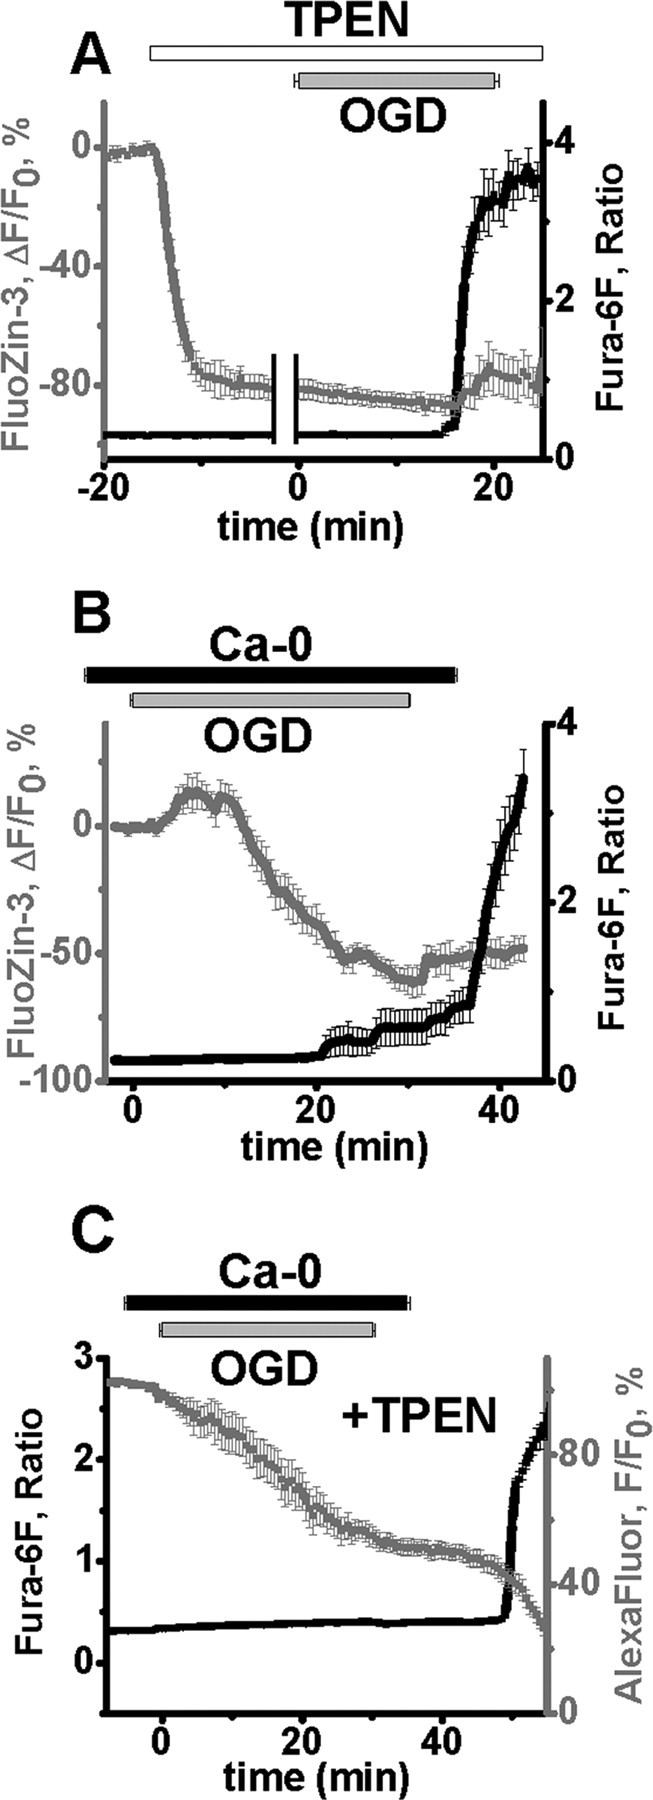
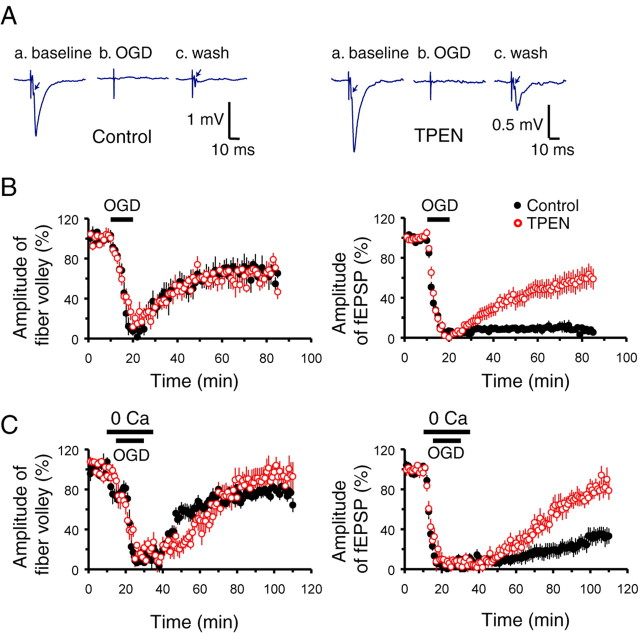
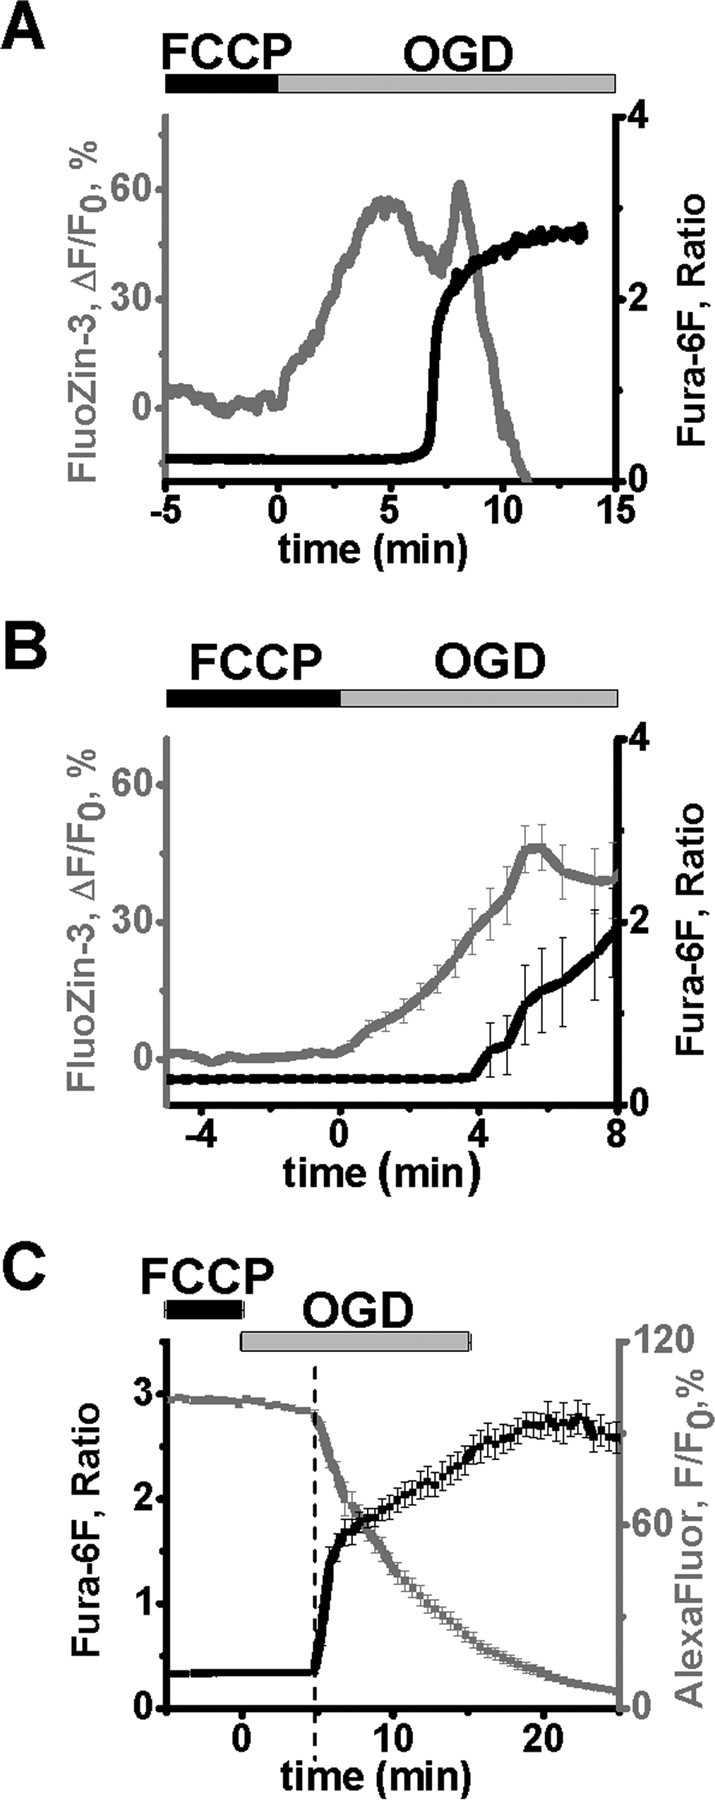
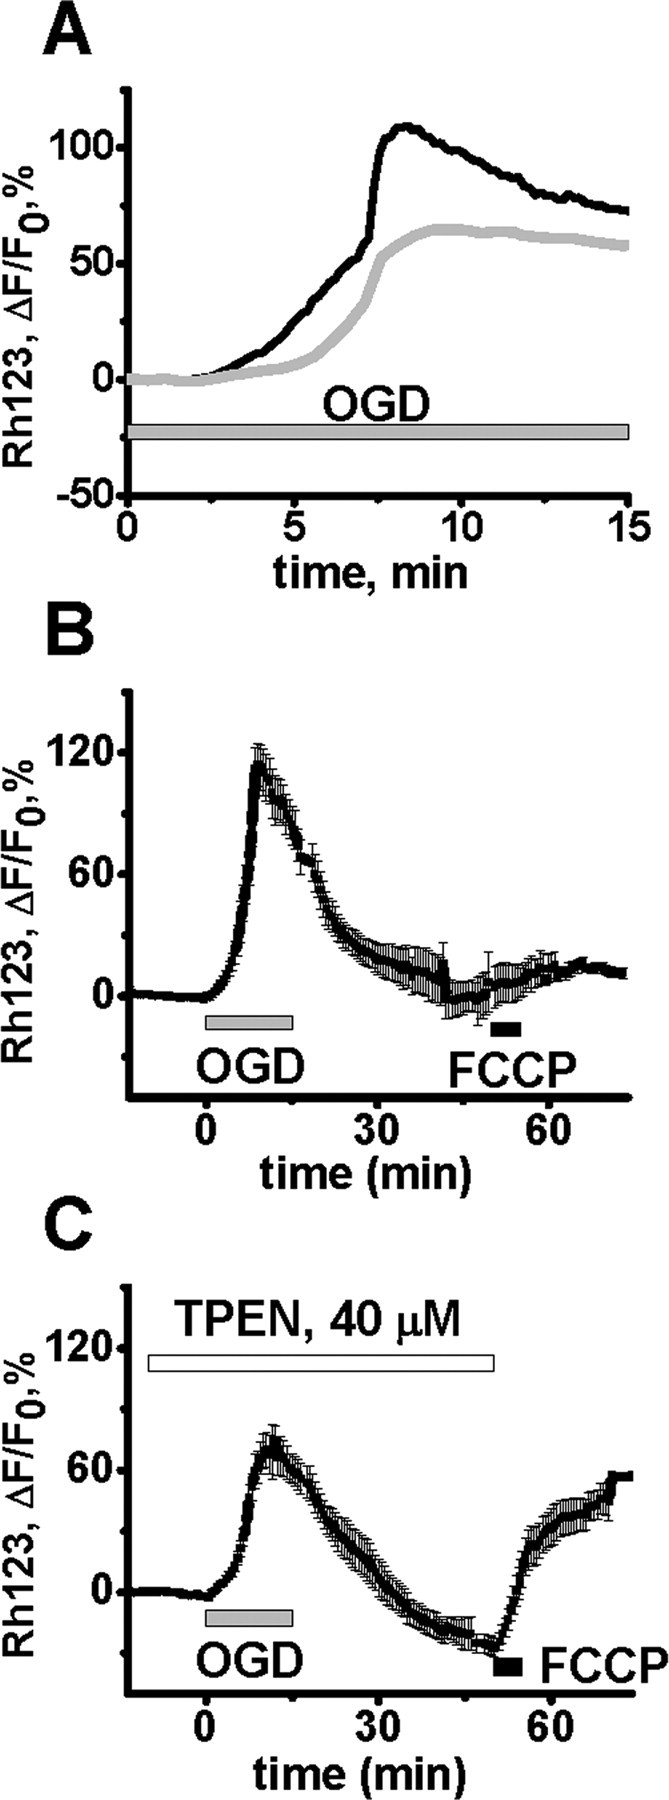
Despite considerable evidence for contributions of both Zn(2+) and Ca(2+) in ischemic brain damage, the relative importance of each cation to very early events in injury cascades is not well known. We examined Ca(2+) and Zn(2+) dynamics in hippocampal slices subjected to oxygen-glucose deprivation (OGD). When single CA1 pyramidal neurons were loaded via a patch pipette with a Ca(2+)-sensitive indicator (fura-6F) and an ion-insensitive indicator (AlexaFluor-488), small dendritic fura-6F signals were noted after several (approximately 6-8) minutes of OGD, followed shortly by sharp somatic signals, which were attributed to Ca(2+) ("Ca(2+) deregulation"). At close to the time of Ca(2+) deregulation, neurons underwent a terminal increase in plasma membrane permeability, indicated by loss of AlexaFluor-488 fluorescence. In neurons coloaded with fura-6F and a Zn(2+)-selective indicator (FluoZin-3), progressive rises in cytosolic Zn(2+) levels were detected before Ca(2+) deregulation. Addition of the Zn(2+) chelator N,N,N',N'-tetrakis(2-pyridylmethyl)ethylenediamine (TPEN) significantly delayed both Ca(2+) deregulation and the plasma membrane permeability increases, indicating that Zn(2+) contributes to the degenerative signaling. Present observations further indicate that Zn(2+) is rapidly taken up into mitochondria, contributing to their early depolarization. Also, TPEN facilitated recovery of the mitochondrial membrane potential and of field EPSPs after transient OGD, and combined removal of Ca(2+) and Zn(2+) markedly extended the duration of OGD tolerated. These data provide new clues that Zn(2+) accumulates rapidly in neurons during slice OGD, is taken up by mitochondria, and contributes to consequent mitochondrial dysfunction, cessation of synaptic transmission, Ca(2+) deregulation, and cell death.


Figures

Figure 1.
Figure 1.
OGD induces Ca2+ deregulation followed by loss of membrane integrity in CA1 neurons. A, Fluorescence images of an individual CA1 neuron coloaded via a patch pipette with a ratiometric Ca2+-sensitive indicator (top panels; 340/380 nm fura-6F ratio images) and an ion-insensitive fluorescent marker (bottom panels; AlexaFluor-488 fluorescence). Arrow indicates the location of the dendritic measurements, and numbers indicate time (in minutes) following onset of OGD. B, Traces show somatic fura-6F ratio (black) and AlexaFluor-488 (red) fluorescence changes in the same neuron illustrated in A. The gray trace shows the fura-6F changes in the dendrite. C, Traces show mean fluorescence changes (±SEM) from the somata of 10 CA1 neurons (black: fura-6F ratio, red: AlexaFluor-488). Individual responses have been aligned to the onset of an irrecoverable fura-6F ratio increases (“Ca2+ deregulation”) in each neuron (dashed line, 9.0 ± 0.34 min). The OGD bar shows the time of OGD exposure (±SEM). Note the abrupt acceleration in the loss of AlexaFluor-488 fluorescence, indicative of a terminal loss of membrane integrity, starting close to the time of Ca2+ deregulation.
Figure 2.
Figure 2.
Zn2+ and Ca2+ contribute to OGD-induced damage of CA1 pyramidal neurons. A, Ca2+ removal during OGD prevents the Ca2+ deregulation. CA1 neurons were loaded with fura-6F (black) and AlexaFluor-488 (gray). Slices were superfused with Ca2+-free ACSF for 5 min before, during, and for 5 min after a 30 min episode of OGD. In cells exposed to OGD for 30 min, Ca2+ deregulation occurred almost immediately (1.5 ± 0.6 min, n = 8) after restoration of Ca2+ to the media, and as previously observed with Ca2+ containing ACSF, was accompanied by an abrupt acceleration in the rate of AlexaFluor-488 fluorescence loss, indicative of a terminal loss of membrane integrity. The slow loss of AlexaFluor-488 fluorescence throughout the OGD appeared to be largely attributable to enhanced cell swelling during zero-Ca2+ OGD. Individual responses (±SEM) have been aligned to the onset of Ca2+ deregulation, and the OGD bar shows the time of OGD exposure (±SEM), as above. B, TPEN significantly delays OGD-evoked Ca2+ deregulation. Neurons were loaded with fura-6F (black) and AlexaFluor-488 (gray), and exposed to TPEN (40 μm) before and during OGD exposure in normal Ca2+ containing ACSF (n = 12). Fura-6F signal increases and loss of membrane integrity (indicated by loss of AlexaFluor-488 fluorescence) (±SEM) still occurred, but were significantly delayed compared with responses in normal ACSF (see Fig. 1C). Individual responses have been aligned to the onset of Ca2+ deregulation, and the OGD bar shows the time of OGD exposure (±SEM), as above.
Figure 3.
Figure 3.
OGD-evoked Zn2+ rises precede the Ca2+ deregulation. A, Fluorescence images of an individual CA1 neuron coloaded via a patch pipette with a ratiometric Ca2+-sensitive indicator (top panels; 340/380 nm fura-6F ratio images) and a Zn2+ selective indicator (bottom panels; FluoZin-3). Arrow indicates the location of the dendritic measurements, and numbers indicate time (in minutes) following onset of OGD. B, Traces show somatic FluoZin-3 fluorescence (blue) and fura-6F ratio (black) changes in the same neuron illustrated in A. The gray trace shows the fura-6F changes in the dendrite. C, Traces show mean somatic FluoZin-3 fluorescence (blue) and fura-6F ratio (black) changes from 9 CA1 neurons, and are aligned for the onset of the Ca2+ deregulation. The OGD bar shows the time of OGD exposure (±SEM). The onset of the Zn2+ rise (7.74 ± 0.23 min) preceded the Ca2+ deregulation (10.27 ± 0.32 min) in all neurons.
Figure 4.
Figure 4.
Ca2+ and Zn2+ both are involved in triggering of OGD evoked Ca2+ deregulation. A, Bath application of TPEN effectively chelates intraneuronal Zn2+ and significantly delays OGD-evoked Ca2+ deregulation. Neurons were coloaded with FluoZin-3 and fura-6F, and exposed to TPEN (40 μm) for 15 min before and during OGD. TPEN decreased basal FluoZin-3 fluorescence by 80 ± 3.2% within 10 min of application (gray), without affecting the fura-6F 340/380 nm ratio (black) (left side of panel; traces aligned to the addition of TPEN). Subsequent OGD exposures evoked Ca2+ deregulation (as indicated by a sharp fura-6F ratio increase), which was significantly delayed (n = 6, 16.0 ± 0.91 vs 10.27 ± 0.32 min in control, n = 9), but greatly reduced changes in FluoZin-3 fluorescence (which remained well below basal fluorescence) (right side of panel; traces aligned to onset of Ca2+ deregulation). All data (±SEM) are obtained from the same 6 CA1 neurons. B, OGD-induced Zn2+ rises still occur despite removal of extracellular Ca2+. Neurons were coloaded with FluoZin-3 and fura-6F and slices superfused with Ca2+-free ACSF for 5 min before, during and for 5 min after a 30 min episode of OGD. During prolonged OGD in Ca2+-free ACSF, Zn2+ rises still occurred after 5–10 min (as in the presence of Ca2+) (Fig. 3). However, under these conditions the peak FluoZin-3 fluorescence increase seemed to be blunted, followed by a slow decrease in fluorescence due to enhanced cell swelling which occurred during OGD exposures in Ca2+-free ACSF. The Ca2+ deregulation occurred shortly after replacement of Ca2+, and was unaccompanied by major changes in the FluoZin-3 fluorescence. Traces show mean values ± SEM. C, TPEN significantly delays the Ca2+ deregulation after prolonged OGD in Ca2+-free ACSF. CA1 neurons were subjected to OGD in nominally Ca2+-free ACSF as in Figure 2A, but in the presence of TPEN (40 μm). Under these conditions the Ca2+ deregulation and associated abrupt loss of AlexaFluor-488 fluorescence still occurred, but were markedly delayed (14.2 ± 1.5 min after Ca2+ replacement, p < 0.001 vs no TPEN condition; n = 7 cells, ±SEM).
Figure 5.
Figure 5.
Ca2+ and Zn2+ both contribute to the loss of synaptic transmission after OGD. Extracellular stimulating and recording electrodes were placed in the Schaffer collateral pathway and stimuli delivered every 20 s, before, during, and after OGD. A, Representative traces at baseline, at the end of a 10 min period of OGD, and after 30 min recovery, in the absence (left) and presence (right) of TPEN. Arrow shows the presynaptic fiber volley, preceding the fEPSP. Note that TPEN enhances recovery of the fEPSP. B, Zn2+ contributes to the loss of synaptic transmission with 10 min OGD. OGD caused a rapid loss of both the presynaptic fiber volley (left) and the fEPSP (right). Note that the fiber volley recovered regardless of the presence of TPEN, but that the fEPSP did not recover unless TPEN was present. C, Zn2+ also contributes to the loss of synaptic transmission with longer (15 min) OGD in Ca2+-free ACSF. With 15 min OGD in normal ACSF, there was no recovery of the fEPSP regardless of the presence of TPEN (data not shown). To examine possible interactions between Zn2+ and Ca2+ in the loss of transmission, slices were perfused with Ca2+-free ACSF for 5 min before and after a 15 min episode of OGD. As above, OGD caused a rapid loss of both the presynaptic fiber volley (left) and the fEPSP (right), with the fiber volley recovering regardless of the presence of TPEN, but recovery of the fEPSP greatly improved in the presence of TPEN. Thus, with this longer period of OGD, both Ca2+ and Zn2+ contribute to the irreversible loss of transmission. All traces show normalized amplitudes ± SEM.
Figure 6.
Figure 6.
Partial mitochondrial uncoupling results in accelerated OGD-induced Zn2+ rises and Ca2+ deregulation. Neurons were loaded as indicated and exposed to FCCP (5 μm) for 5 min, followed by 15 min OGD. A, Traces from a representative neuron show that both the initial Zn2+ rise (gray) and the Ca2+ deregulation (black) were substantially accelerated, with the Zn2+ rise beginning within the first minute of OGD. B, Average traces (±SEM) from 10 CA1 neurons show the Zn2+ rise (gray; at 0.79 ± 0.50 min) and the Ca2+ deregulation (black, 5.3 ± 0.38 min). Data are aligned to the OGD onset to show the start of early [Zn2+]I rise. C, The accelerated OGD-induced Ca2+ deregulation after FCCP exposure is still linked to a membrane permeability increase. CA1 neurons were loaded with fura-6F and AlexaFluor-488, and exposed to FCCP before 15 min OGD as above. Traces (±SEM) are aligned to the start of the Ca2+ deregulation (4.9 ± 0.29 min, n = 10 cells).
Figure 7.
Figure 7.
Zn2+ contributes to mitochondrial depolarization during OGD. Slices were bath loaded with the mitochondrial potential (ΔΨm)-sensitive indicator Rhodamine 123 (Rh123), and subjected to 15 min of OGD in the absence or presence of TPEN (40 μm). A, Trace shows representative OGD-induced Rh123 fluorescence changes in the CA1 pyramidal cell layer of a control slice (black), and one in which TPEN was present (gray). An increase in fluorescence indicates loss of ΔΨm. B, OGD induces a long lasting loss of ΔΨm. After 15 min OGD, slices were allowed to recover for 35 min before exposure to 5 μm FCCP, to directly induce loss of ΔΨm (peak ΔF/F0 during OGD, 107 ± 7.35%; peak increase after FCCP, 14.1 ± 4.7%, n = 6). C, TPEN improves recovery of ΔΨm after OGD. Slices were subjected to 15 min OGD as above but in the additional presence of TPEN, and 35 min later exposed to FCCP. The presence of TPEN resulted in a decreased peak ΔF/F0 during OGD (73 ± 6.96%, p < 0.01 vs no TPEN), and an increased response to FCCP (65.9 ± 7.2%, p < 0.01 vs no TPEN, n = 7), indicating a substantial recovery of ΔΨm after OGD. In B and C, traces show mean values ± SEM.

Similar articles

Cited by

References

    1. Arslan P, Di Virgilio F, Beltrame M, Tsien RY, Pozzan T. Cytosolic Ca2+ homeostasis in Ehrlich and Yoshida carcinomas. A new, membrane-permeant chelator of heavy metals reveals that these ascites tumor cell lines have normal cytosolic free Ca2+ J Biol Chem. 1985;260:2719–2727. - PubMed
    1. Bahar S, Fayuk D, Somjen GG, Aitken PG, Turner DA. Mitochondrial and intrinsic optical signals imaged during hypoxia and spreading depression in rat hippocampal slices. J Neurophysiol. 2000;84:311–324. - PubMed
    1. Bonanni L, Chachar M, Jover-Mengual T, Li H, Jones A, Yokota H, Ofengeim D, Flannery RJ, Miyawaki T, Cho CH, Polster BM, Pypaert M, Hardwick JM, Sensi SL, Zukin RS, Jonas EA. Zinc-dependent multi-conductance channel activity in mitochondria isolated from ischemic brain. J Neurosci. 2006;26:6851–6862. - PMC - PubMed
    1. Bossy-Wetzel E, Talantova MV, Lee WD, Schölzke MN, Harrop A, Mathews E, Götz T, Han J, Ellisman MH, Perkins GA, Lipton SA. Crosstalk between nitric oxide and zinc pathways to neuronal cell death involving mitochondrial dysfunction and p38-activated K(+) channels. Neuron. 2004;41:351–365. - PubMed
    1. Brown AM, Kristal BS, Effron MS, Shestopalov AI, Ullucci PA, Sheu KF, Blass JP, Cooper AJ. Zn2+ inhibits alpha-ketoglutarate-stimulated mitochondrial respiration and the isolated alpha-ketoglutarate dehydrogenase complex. J Biol Chem. 2000;275:13441–13447. - PubMed

Publication types

MeSH terms

LinkOut - more resources