. 2009 Jan 28;29(4):1175-90.
doi: 10.1523/JNEUROSCI.3328-08.2009.

Connectivity-based parcellation of human cingulate cortex and its relation to functional specialization

Affiliations

Connectivity-based parcellation of human cingulate cortex and its relation to functional specialization

Matthias Beckmann et al. J Neurosci. .

Abstract

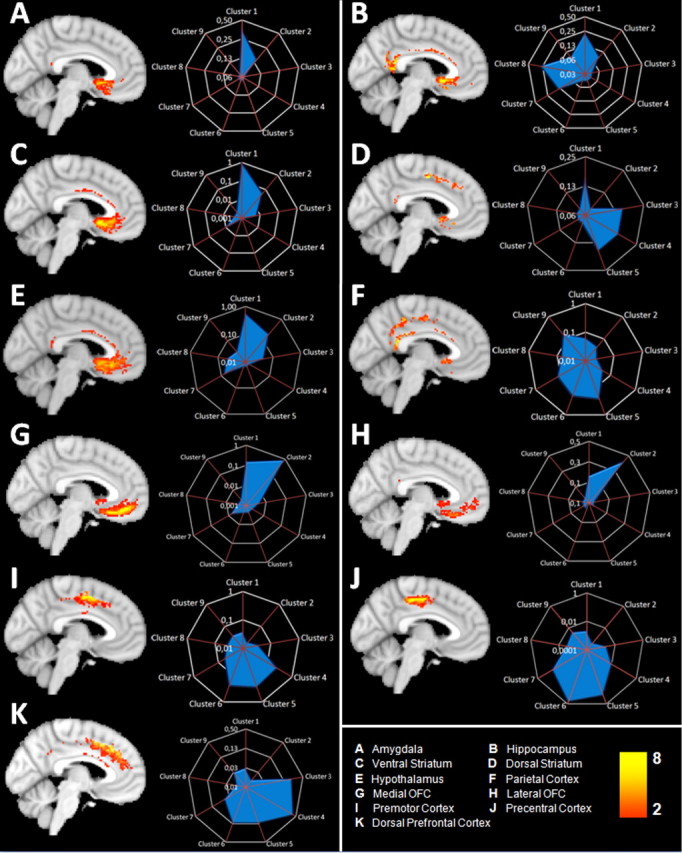
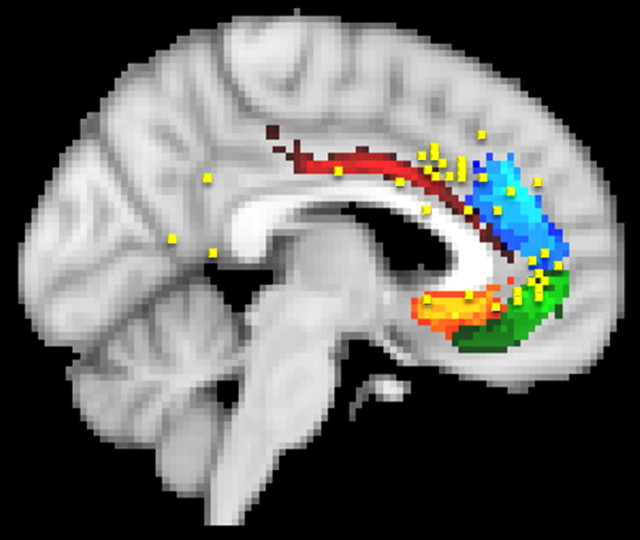
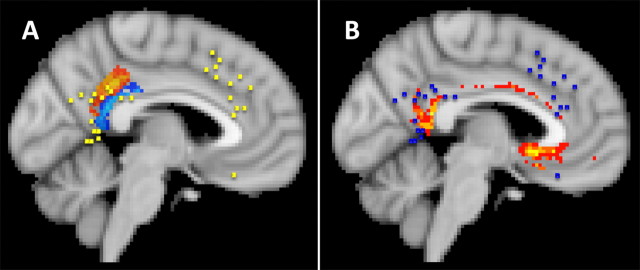
Whole-brain neuroimaging studies have demonstrated regional variations in function within human cingulate cortex. At the same time, regional variations in cingulate anatomical connections have been found in animal models. It has, however, been difficult to estimate the relationship between connectivity and function throughout the whole cingulate cortex within the human brain. In this study, magnetic resonance diffusion tractography was used to investigate cingulate probabilistic connectivity in the human brain with two approaches. First, an algorithm was used to search for regional variations in the probabilistic connectivity profiles of all cingulate cortex voxels with the whole of the rest of the brain. Nine subregions with distinctive connectivity profiles were identified. It was possible to characterize several distinct areas in the dorsal cingulate sulcal region. Several distinct regions were also found in subgenual and perigenual cortex. Second, the probabilities of connection between cingulate cortex and 11 predefined target regions of interest were calculated. Cingulate voxels with a high probability of connection with the different targets formed separate clusters within cingulate cortex. Distinct connectivity fingerprints characterized the likelihood of connections between the extracingulate target regions and the nine cingulate subregions. Last, a meta-analysis of 171 functional studies reporting cingulate activation was performed. Seven different cognitive conditions were selected and peak activation coordinates were plotted to create maps of functional localization within the cingulate cortex. Regional functional specialization was found to be related to regional differences in probabilistic anatomical connectivity.


Figures

Figure 1.
Figure 1.
A, The group average whole CSM superimposed on the group average structural MRI scan in MNI space on a sagittal section (x = −4). B, Coronal section at y = 24 (as marked by the light blue line in A), showing the lateral extension of the mask into paracingulate and sulcal areas.
Figure 2.
Figure 2.
Group average extracingulate target masks superimposed on the MNI 152 T1 standard brain. A, A coronal section (y = −8) showing parts of the group average hypothalamus (yellow), amygdalae (dark red), and hippocampus (dark blue) target masks. B, A coronal section (y = 14) showing the group average dorsal striatum (yellow), ventral striatum (light blue), medial (green), and lateral (orange) orbitofrontal cortex target masks. C, A sagittal section (x = −18) showing the group average hippocampus (dark blue), lateral orbitofrontal (orange), dorsal prefrontal (yellow), premotor (light blue), precentral (red), and parietal (green) cortex target masks. D, An axial section (z = 56) showing the group average dorsal prefrontal (yellow), premotor (light blue), precentral (red), and parietal (green) cortex target masks.
Figure 3.
Figure 3.
Connectivity-based parcellation of human cingulate cortex. The parcellation analysis resulted in the reliable detection of nine clusters in similar positions in all subjects. The position of the nine clusters in an example subject who lacked a clearly defined paracingulate sulcus (A) and in a subject with an identifiable paracingulate sulcus (B). Average maps were constructed for the group of subjects (n = 3) without clearly identifiable paracingulate sulci (C) and the group (n = 8) with identifiable paracingulate sulci (D). Clusters are identified on group maps wherever there is an overlap in their positions in more than two subjects (for the group of 3 subjects without paracingulate sulci; C) or more than five subjects (for the group of 8 subjects with paracingulate sulci; D). Clusters can be seen in approximately similar positions in the two groups of subjects. E, The average positions of the clusters (6 subject threshold overlap) for the entire group of 11 subjects is also shown. F, The variability in cluster position across individuals can be visualized by plotting the center of gravity of each cluster in each individual on the same image. Points of the same color refer to the centers of gravity of a given cluster in each subject. Occasionally, the center of gravity of a given cluster was the same in two subjects, and only a single point is plotted to represent both subjects. The centers of gravity of different clusters never overlapped in different subjects. Some of the centers of gravity were placed on the corpus callosum, although the clusters themselves did not overlap with the corpus callosum. All MRI scans are sagittal sections [x = −4, MNI coordinate system (Collins et al., 1994)]. Individual subject data are shown on the same individuals' structural MRI scans. All group data are shown on the MNI standard brain.
Figure 4.
Figure 4.
The parcellation clusters resemble regions identified in previous studies. A, Cluster 1 occupies a similar position to the subcallosal cingulate region identified by Johansen-Berg et al. (2007). Johansen-Berg and colleagues performed a diffusion-weighted imaging tractography parcellation analysis of the region targeted in deep brain stimulation for depression (area colored blue or yellow within the oval). They identified two component clusters (shown in blue and in yellow), one of which (yellow) corresponds in location to cluster 1 in the current study. Cluster 1 also occupies a similar position to area 25 as identified in previous cytoarchitectonic analyses of the human brain conducted by Petrides and Pandya (1994), figure adapted by mirroring to match brain orientation (B), and Vogt (2008), figure adapted by mirroring to match brain orientation (C). Note that, in this recent diagram, the label 24 is assigned to tissue sometimes divided into subareas 24a and 24b, and the labels 23d, 23v, and v23 are assigned to tissue sometimes divided into 23a and 23b. D, According to some researchers (Ongur et al., 2003), this region may be further subdivided into areas 25 and 32pl. The positions of clusters 2 and 3 resemble those of the medial extension of area 10, 10m, and 32ac (D). Vogt et al. (2005) have also identified area 10m in a similar position ventral to cingulate cortex and dorsal to orbitofrontal cortex in the macaque (data not shown). It is important to note that Ongur and colleagues only analyzed the region outlined by the light blue dotted line, and so they did not report on the posterior extension of area 32ac. The position of clusters 4–6 resemble those of cingulate sulcus regions 24c and 23c (C). The position of cluster 7 resembles that of 24a/b (B–D). The positions of clusters 8 and 9 resemble those of areas 23a/b and of area 31, respectively (B, C).
Figure 5.
Figure 5.
A, Group overlay of voxels with a high probability of interconnection with the amygdala, thresholded at no less than two subjects (thus excluding voxels that had survived initial thresholding in a single subject only). Note, however, that yellow voxels are ones in which connections to a given area were found in eight or more subjects. Amygdala connectivity fingerprint showing the relative connection probability between the amygdala and the nine cingulate/medial frontal clusters. The highest amygdala connection probabilities were with clusters 1, 2, and 7. Note that the connectivity fingerprint gives a threshold-free indication of the average strength (across all subjects) of connection between each cingulate/medial frontal cluster and each target region. Regions with a high probability of interconnection and connectivity fingerprints are shown for the hippocampus (B), ventral striatum (C), dorsal striatum (D), hypothalamus (E), parietal cortex (F), medial orbitofrontal cortex (G), lateral orbitofrontal cortex (H), premotor cortex (I), precentral cortex (J), and dorsal prefrontal cortex (K). Note that all fingerprint figures are plotted using a log scale, but that scaling varies.
Figure 6.
Figure 6.
Peak activations from neuroimaging studies of pain are found predominantly in the supracallosal cingulate cortex (blue squares). Many of the activations are in the ventral part of this region in cluster 7, but some fall in the more anterior cingulate sulcus in cluster 5. Cluster 5 may include the CMAr. Morrison and colleagues (Morrison and Downing, 2007; Morrison et al., 2007) have argued that rostral cingulate motor areas are also active when experimental participants are subjected to painful stimulation.
Figure 7.
Figure 7.
A, The dorsal cingulate sulcal clusters were activated during motor tasks (blue squares). There was a clear tendency for all three clusters, 4–6, to be activated during motor tasks, and it was clear that motor tasks do not activate the more ventral supracallosal region sometimes activated during painful stimulation (Fig. 6). A similar region was highly likely to be interconnected with premotor and precentral cortex (Fig. 5G,H). B, Picard and Strick (2001) argued that two motor-related regions can be distinguished within the anterior cingulate cortex that they refer to as the anterior and posterior rostral cingulate motor zones (RCZa and RCZp). Crosshairs indicate the medians of coordinates as retrieved from Picard and Strick's meta-analysis of functional studies reporting activation during “action selection” (red) and “conflict” (yellow) conditions. It is clear that they lie over the centers of clusters 4 and 5. Activations related to conflict monitoring (C; blue squares, crosshairs mark the median of coordinates of our own, independent meta-analysis) and error detection (D; blue squares) were mainly found in the more anterior dorsal supracallosal cingulate cortex in cluster 4 and sometimes cluster 3. Picard and Strick also identified a caudal CCZ. Cluster 6 occupies an approximately similar location to that suggested for CCZ. Cluster 6 was distinguished from the other motor-related regions in the supracallosal, dorsal cingulate cortex by its high probability of interconnection with the motor cortex in precentral gyrus and with parietal cortex. In these two respects, it resembles the more caudal cingulate motor cortex of the macaque.
Figure 8.
Figure 8.
A, Reward-related activations were found in two regions in the meta-analysis (blue squares). First, there was a relatively dorsal region of activation in the dorsal anterior cingulate sulcus and paracingulate regions in clusters 4 and 3. This is consistent with CMAr and the tissue immediately rostral to it being important for both reward and error processing in both macaques and humans (Walton et al., 2004; Kennerley et al., 2006). The second region was in the ventromedial frontal cortex and overlapped with cluster 2. The picture of reward-related activation in this region provided by the meta-analysis may be incomplete because this region has been described variously as cingulate cortex, ventromedial frontal cortex, medial frontal cortex, and orbitofrontal cortex in different published reports. An additional survey of studies investigating reward and particularly reward expectation, often using computationally derived regressors that attempt to quantify the degree of reward expectation, found a number of additional activations in the cluster 2 region (shown in yellow). B, Detail of A.
Figure 9.
Figure 9.
Emotion-related activations (yellow squares) overlapped with the positions of cluster 1 and the reward-related activations in cluster 2.
Figure 10.
Figure 10.
A, Two regions of memory-related activations (yellow squares in A, blue squares in B) were found. The more anterior region overlapped with error- and conflict-related activations but a distinct posterior region overlapping with retrosplenial clusters 8 and 9 was also activated by memory tasks. B, The same posterior cingulate region that was associated with memory was also associated with a high probability of connection to the hippocampus.

References

    1. Alkadhi H, Crelier GR, Boendermaker SH, Hepp-Reymond MC, Kollias SS. Somatotopy in the ipsilateral primary motor cortex. Neuroreport. 2002a;13:2065–2070. - PubMed
    1. Alkadhi H, Crelier GR, Boendermaker SH, Golay X, Hepp-Reymond MC, Kollias SS. Reproducibility of primary motor cortex somatotopy under controlled conditions. Am J Neuroradiol. 2002b;23:1524–1532. - PMC - PubMed
    1. Amaral DG, Price JL. Amygdalo-cortical projections in the monkey (Macaca fascicularis) J Comp Neurol. 1984;230:465–496. - PubMed
    1. Amodio DM, Frith CD. Meeting of minds: the medial frontal cortex and social cognition. Nat Rev Neurosci. 2006;7:268–277. - PubMed
    1. Anwander A, Tittgemeyer M, von Cramon DY, Friederici AD, Knösche TR. Connectivity-based parcellation of Broca's area. Cereb Cortex. 2007;17:816–825. - PubMed

Publication types