. 2007 Jun;1(1):159-185.
doi: 10.2217/17520363.1.1.159.

The future of liquid chromatography-mass spectrometry (LC-MS) in metabolic profiling and metabolomic studies for biomarker discovery

Affiliations

The future of liquid chromatography-mass spectrometry (LC-MS) in metabolic profiling and metabolomic studies for biomarker discovery

Thomas O Metz et al. Biomark Med. 2007 Jun.

Abstract

The future utility of liquid chromatography-mass spectrometry (LC-MS) in metabolic profiling and metabolomic studies for biomarker discover will be discussed, beginning with a brief description of the evolution of metabolomics and the utilization of the three most popular analytical platforms in such studies: NMR, GC-MS, and LC-MS. Emphasis is placed on recent developments in high-efficiency LC separations, sensitive electrospray ionization approaches, and the benefits to incorporating both in LC-MS-based approaches. The advantages and disadvantages of various quantitative approaches are reviewed, followed by the current LC-MS-based tools available for candidate biomarker characterization and identification. Finally, a brief prediction on the future path of LC-MS-based methods in metabolic profiling and metabolomic studies is given.


Figures
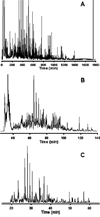
Figure 1
Figure 1. Analysis of the Shewanella oneidensis metabolome utilizing reversed-phase capillary LC coupled with FTICR MS
Cells of S. oneidensis were lysed via bead-beating and the metabolome extracted using cold (−20°C) acetone with concomitant protein precipitation and removal via centrifugation. The supernatant containing the extracted metabolome was dried in vacuo and reconstituted in Nanopure water prior to sample injection. The LC conditions were as follows: operating pressure of 20,000 psi; mobile phase A consisted of 0.2% acetic acid + 0.05% trifluoroacetic acid in water; mobile phase B consisted of 0.1% trifluoroacetic acid in 90% acetonitrile + 10% water; gradient elution was by exponential gradient as a result of constant pressure operation. The MS detector consisted of an 11 Tesla FTICR MS utilizing home-built ion transmission optics, which was operated in the mass range of 100–1500 m/z. Reversed-phase C18 capillary columns: (A) 50 µm i.d. × 2 m, 3 µm dP, (B) 50 µm i.d. × 50 cm, 2 µm dP, (C) 50 µm i.d. × 20 cm, 1.4 µm dP. Peak-capacities of ~1500, ~500, and ~350 were calculated for the separations shown in A, B, and C, respectively. Figure 1A reproduced with permission from Anal. Chem. 2005, 77, 3090–3100. Copyright 2005 American Chemical Society. Figures 1B and 1C unpublished data.
Figure 2
Figure 2. Cartoon depicting the various factors leading to improved ESI efficiency during nano-ESI as compared to conventional-ESI
Note: The ions depicted represent analyte ions only; typically, each droplet would also contain many counter ions from the LC solvent.
Figure 3
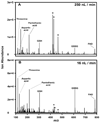
Figure 3. Comparison of ion intensities for a metabolite mixture analyzed by two nano-ESI flow rates
An equimolar mixture (10 µM) of threonine, aspartic acid, pantothenic acid, reduced glutathione (GSH), oxidized glutathione (GSSG), and flavin adenine dinucleotide (FAD) in water:acetonitrile (50:50, v/v) was electrosprayed in negative-ESI mode. (A) flow rate of 250 nL/min, (B) flow rate of 16 nL/min. The MS utilized was an Agilent TOF. Unpublished data.
Figure 4
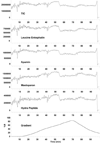
Figure 4. MS total ion chromatogram and peak intensities for a four peptide mixture during the course of an LC solvent gradient
The peptide solution was continuously delivered to a mixing tee at 0.2 µL/min and combined with the LC solvent gradient flowing at 2.0 µL/min. The mixed solution was analyzed by ESI-MS using a single quadrupole mass spectrometer. A linear gradient was created using an Agilent 1100 LC system and two different mobile phases (A and B). Mobile phase A consisted of 0.2% acetic acid and 0.05% TFA in water, and mobile phase B consisted of 0.1% TFA in 90% acetonitrile and 10% water. The bottom frame shows the percentage of mobile phase B as a function of time. Unpublished data.
Figure 5
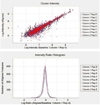
Figure 5. Reproducibility of dual-column capillary LC-MS analyses of Cyanothece sp. ATCC 51142 metabolite extract
An in-house constructed dual-column capillary LC system was coupled with an LTQ-Orbitrap MS and utilized in replicate analyses of the same Cyanothece metabolite extract. Five replicates of the same sample were analyzed on both columns, and nine datasets were used for comparative analyses (Column 1, Rep D was excluded from the data analysis due to the presence of air bubbles during injection). The upper panel illustrates the agreement between intensity measurements for individual features in the aligned and baseline datasets. The lower panel illustrates agreement between intensity measurements in the aligned and baseline datasets, in terms of an intensity ratio histogram. The dataset corresponding to Column 1, Rep A was arbitrarily selected as a baseline for both chromatographic alignment and intensity normalization. Unpublished data.
Figure 6
Figure 6. Comparison of theoretical and experimental isotopic distributions for four human plasma metabolites
The analysis of human plasma was conducted as described in the legend for Table 1. The theoretical isotopic distributions (blue) for (A) tryptophan (205.0977 Da), (B) palmitoylglycerophosphatidylcholine (496.3403 Da), (C) bilirubin (585.2713 Da), and (D) riboflavin (377.1461 Da) are overlaid with the experimentally measured isotopic distributions (green). Further validation of tentative identifications was made using accurate mass measurements (see Table 1) targeted MS/MS data and comparison to authentic standards, as applicable. Comparison of theoretical and experimental isotopic distributions was performed using the Molecular Weight Calculator available at http://ncrr.pnl.gov/software/MWCalculator.stm. Note that the Molecular Weight Calculator software does not generate isotopic distributions with resolution comparable to the obtained via Orbitrap MS. Unpublished data.

References

    1. Nicholson JK, Lindon JC, Holmes E. 'Metabonomics': understanding the metabolic responses of living systems to pathophysiological stimuli via multivariate statistical analysis of biological NMR spectroscopic data. Xenobiotica. 1999;29:1181–1189. - PubMed
    1. Nicholson JK, Connelly J, Lindon JC, Holmes E. Metabonomics: a platform for studying drug toxicity and gene function. Nat. Rev. Drug Discov. 2002;1:153–161. - PubMed
    1. Nicholson JK, Wilson ID. Understanding 'global' systems biology: metabonomicsand the continuum of metabolism. Nat. Rev. Drug Discov. 2003;2:668–676. - PubMed
    1. Lindon JC, Holmes E, Nicholson JK. So what's the deal with metabonomics? Anal. Biochem. 2003;75:384A–391A. - PubMed
    1. Pauling L. Orthomolecular psychiatry: varying the concentrations of substances normally present in the human body may control mental disease. Science. 1968;160:265–271. - PubMed