. 2009 Jan;18(1):229-39.
doi: 10.1002/pro.8.

RosettaHoles: rapid assessment of protein core packing for structure prediction, refinement, design, and validation

Affiliations

RosettaHoles: rapid assessment of protein core packing for structure prediction, refinement, design, and validation

Will Sheffler et al. Protein Sci. 2009 Jan.

Abstract

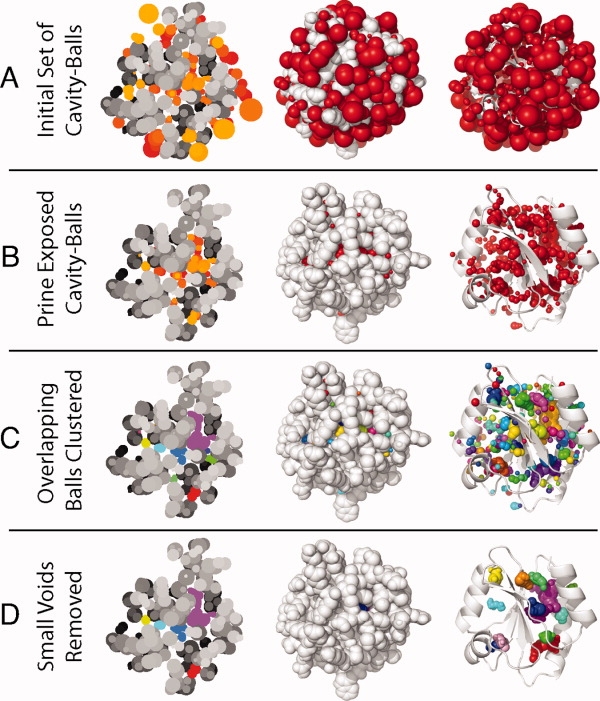
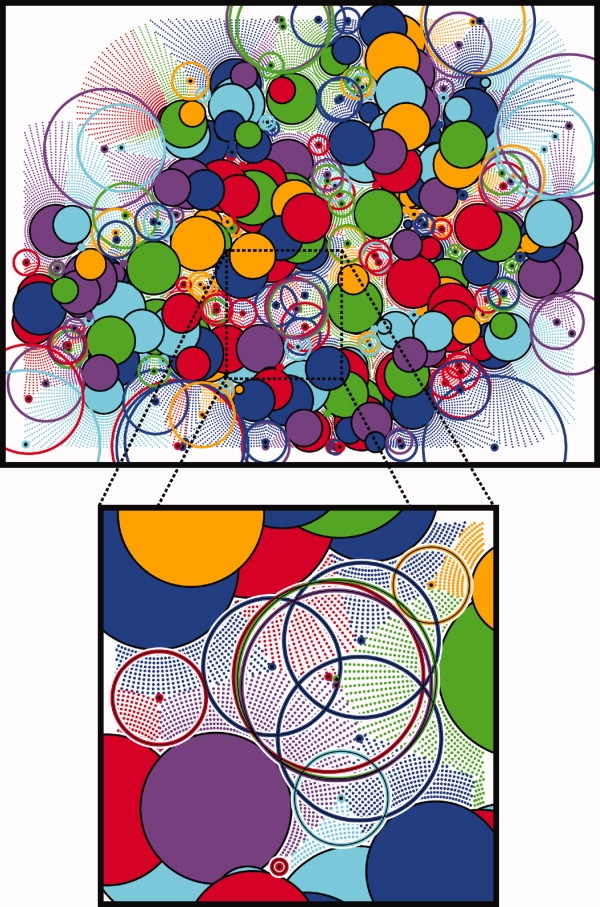
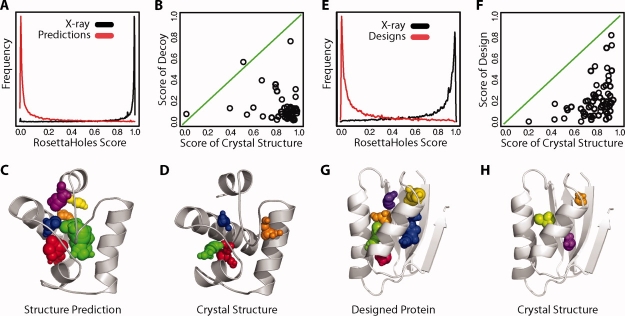
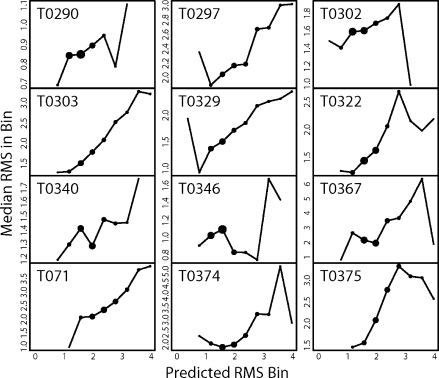
We present a novel method called RosettaHoles for visual and quantitative assessment of underpacking in the protein core. RosettaHoles generates a set of spherical cavity balls that fill the empty volume between atoms in the protein interior. For visualization, the cavity balls are aggregated into contiguous overlapping clusters and small cavities are discarded, leaving an uncluttered representation of the unfilled regions of space in a structure. For quantitative analysis, the cavity ball data are used to estimate the probability of observing a given cavity in a high-resolution crystal structure. RosettaHoles provides excellent discrimination between real and computationally generated structures, is predictive of incorrect regions in models, identifies problematic structures in the Protein Data Bank, and promises to be a useful validation tool for newly solved experimental structures.


Figures

Figure 1
Figure 1
Overview of cavity computation and visualization. (A) All of the spheres computed based on vertices of the approximate Apollonius diagram. (B) Balls remaining after those exposed to the surface are pruned away. (C) Balls clustered into contiguous cavities with an arbitrary color for each cavity. (D) Final clusters remaining after small cavities have been pruned away. In the flat slices on the left, colors are shaded by depth for clarity.
Figure 2
Figure 2
Calculation of cavity balls. Pictured is the result of a 2D implementation of our cavity finding process performed on a slice through the center of heat shock operon repressor HrcA (arbitrarily selected example). Shaded circles represent atoms and the surrounding like-colored dots are closer to that atom than any other. The furthest dot for each atom, which approximates the vertex of the ideal Apollonius diagram, is marked as a larger like-colored dot with a black center. Centered on these dots are the largest empty circles that fit around each vertex and do not intersect any atom. These circles are the 2D analog of the cavity filling balls in our method. Slices of atoms closer to the camera overlap those further from the camera and coloration is arbitrary.
Figure 3
Figure 3
Visualization of cavities. The top panels A, B, C, and D show a crystal structure of CASP6 target 199, heat shock operon repressor HrcA, and the bottom panels E, F, G, and H show a computational structure prediction for this protein. The leftmost panels A and E show the unadorned structure. Panels B and F show the structure with cavity clusters represented explicitly in arbitrary colors to distinguish cavities. The structures in panels C, D, G, and H are colored by the numerical packing score described in the text. The color scale ranges from green to blue to red, with the worst packed regions in red.
Figure 4
Figure 4
Packing quality of protein structure predictions and designs. (A) Distribution of RosettaHoles scores for cavities in predicted and crystal structures (ROC 0.943). In red are the estimated RosettaHoles scores of structure predictions for 42 proteins and in black is the distribution of scores for the set of corresponding crystal structures. (B) RosettaHoles whole-structure score for 42 structure predictions plotted against the score of the corresponding crystal structure. (C) Structure prediction for CASP target 199. (D) Crystal structure for target 199. (E) Distribution of RosettaHoles scores for individual cavities (ROC 0.934). In red are the RosettaHoles scores of fixed backbone redesigns of 62 proteins and in black is the distribution of scores for the set of corresponding crystal structures. (F) RosettaHoles whole-structure score for the 62 designs plotted against the score of the corresponding crystal structure. (G) Fixed backbone design of protein 1cc8. (F) Crystal structure for 1cc8.
Figure 5
Figure 5
Correlation of local packing score with local RMSD. Predicted versus actual RMSD is shown for 12 large (200–400 residue) CASP7 targets. Predicted RMSD was computed exactly as the RosettaHoles scores except that SVM regression was used rather than SVM discrimination. RMSDs to crystal structure were measured over the same 7-Å radius balls of atoms used to compute the estimated RMSD. The atom balls were binned on predicted local RMSD, shown on the x-axis, and the median true RMSD is plotted on the y-axis. The area of each plotted point is proportional to the number of local regions which scored in that bin.
Figure 6
Figure 6
Packing score distributions of predicted and experimental structures. Density plots of the packing score for different X-ray resolution bins as well as for NMR structures and CASP7 models submitted by all groups. Very high-resolution crystal structures (sub-1.0 Å) have systematically better packing scores than all other structures; a 95 percentile structure between 1.0 and 2.0 Å resolution would be merely average for 1.0 Å or better resolution. Similarly, a 95th percentile NMR structure would be average among 1 to 2 Å crystal structures. The computationally generated fullatom models submitted to CASP7 are much worse than experimentally solved structures.
Figure 7
Figure 7
Assessment of PDB structures using RosettaHoles score. RosettaHoles score is plotted versus resolution for 38,061 crystal structures. For clarity, the majority of the points are shown in a 2D histogram, with only points below the dotted line shown explicitly. The plotted points, especially the very lowest ones, have unusually bad packing scores for their resolution. The lowest points at a given resolution were investigated to discover the cause of poor packing quality. (The open circles represent structures that were not further investigated, and the filled circles represent structures that were considered but no explanation could be found.) Many of these structures were published before 1990, and the poor packing may be an artifact of older methodology. Eight of the outlier points are structures associated with KH Murthy (see Ref. 9). For some outliers in the sub-2.0 Å resolution structures, the inclusion of low b-factor buried waters raises the packing score above the plotted diagonal line. Many underpacking outliers have possible inflated unit cells according to WhatCheck.
Figure 8
Figure 8
Differences in atomic arrangement in computational versus experimental structures. (A) The median difference in contact surface area between computationally generated structures and crystal structures for probe radii 0.1 to 2.0 Å in radius. The contact surface area is measured over 7 Å radius balls of atoms surrounding computed cavities. For probes 0.4 Å or larger, the computationally generated models have more exposed surface and crystal structures have more surface exposed to very small probes. (B) The RDF for methyl side chain groups in crystal structures and computationally generated protein structures. In crystal structures, the methyl groups are typically 4.0 Å apart but there is a broad peak. Methyl–methyl pairs in computationally generated models tend to be spaced slightly closer together and have a tighter peak around this value. (C) Model for differences in atom distributions for computed models (black) versus experimentally determined structures (grey). The outline represents the surface exposed to a small or large probe. The evenly packed configuration has more surface area exposed to a small probe while a large probe can access more surface area in the clumped arrangement. We hypothesize the clumped arrangement occurs more frequently in computationally generated structures.

References

    1. Kellis JTJ, Nyberg K, Fersht AR. Energetics of complementary side-chain packingin a protein hydrophobic core. Biochemistry. 1989;28:4914–4922. - PubMed
    1. Erikson AE, Baase WA, Zhang XJ, Heinz DW, Baldwin EP, Mathews BM. Response of a protein structure to cavity-creating mutations and its relation to the hydrophobic effect. Science. 1992;255:178–183. - PubMed
    1. Eriksson AE, Baase WA, Wozniak JA, Mathews BM. A cavity-containing mutant of T4 lysozyme is stabilized by buried benzene. Nature. 1992;355:371–373. - PubMed
    1. Lee B, Richards FM. The interpretation of protein structures: estimation of static accessibility. J Mol Biol. 1971;55:379–400. - PubMed
    1. Liang J, Edelsbrunner H, Fu P, Sudhakar PV, Subramaniam S. Analytical shapecomputation of macromolecules: I. molecular area and volume through alpha shape. Proteins. 1998;33:1–17. - PubMed

Publication types