

Detection of novel biomarkers of liver cirrhosis by proteomic analysis
- PMID: 19177598
- PMCID: PMC2895500
- DOI: 10.1002/hep.22764
Detection of novel biomarkers of liver cirrhosis by proteomic analysis
Abstract
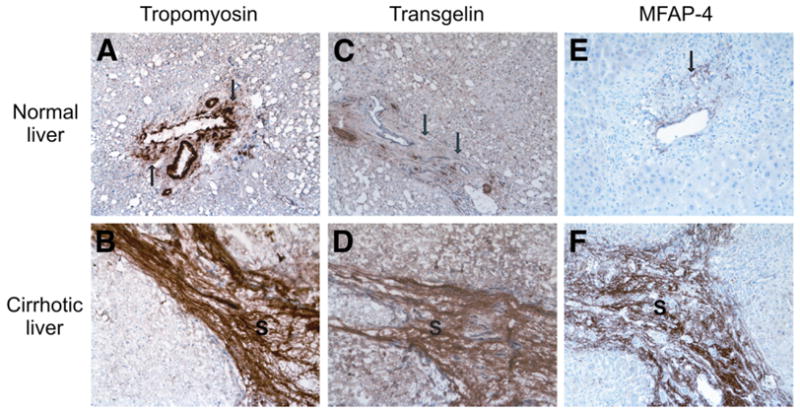
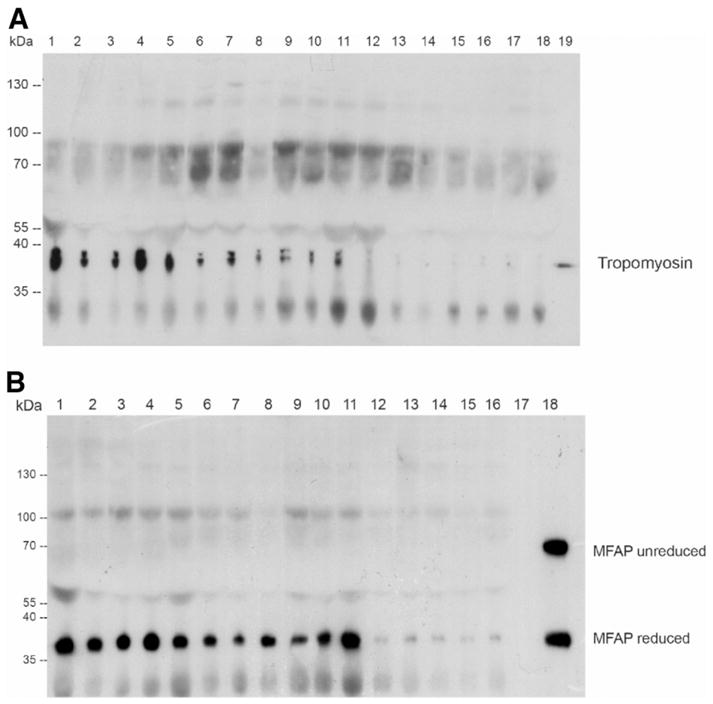
Hepatic cirrhosis is a life-threatening disease arising from different chronic liver disorders. One major cause for hepatic cirrhosis is chronic hepatitis C. Chronic hepatitis C is characterized by a highly variable clinical course, with at least 20% developing liver cirrhosis within 40 years. Only liver biopsy allows a reliable evaluation of the course of hepatitis C by grading inflammation and staging fibrosis, and thus serum biomarkers for hepatic fibrosis with high sensitivity and specificity are needed. To identify new candidate biomarkers for hepatic fibrosis, we performed a proteomic approach of microdissected cirrhotic septa and liver parenchyma cells. In cirrhotic septa, we detected an increasing expression of cell structure associated proteins, including actin, prolyl 4-hydroxylase, tropomyosin, calponin, transgelin, and human microfibril-associated protein 4 (MFAP-4). Tropomyosin, calponin, and transgelin reflect a contribution of activated stellate cells/myofibroblasts to chronic liver injury. The expression of tropomyosin, transgelin, and MFAP-4, an extracellular matrix associated protein, were further evaluated by immunohistochemistry. Tropomyosin and MFAP-4 demonstrated high serum levels in patients with hepatic cirrhosis of different causes.
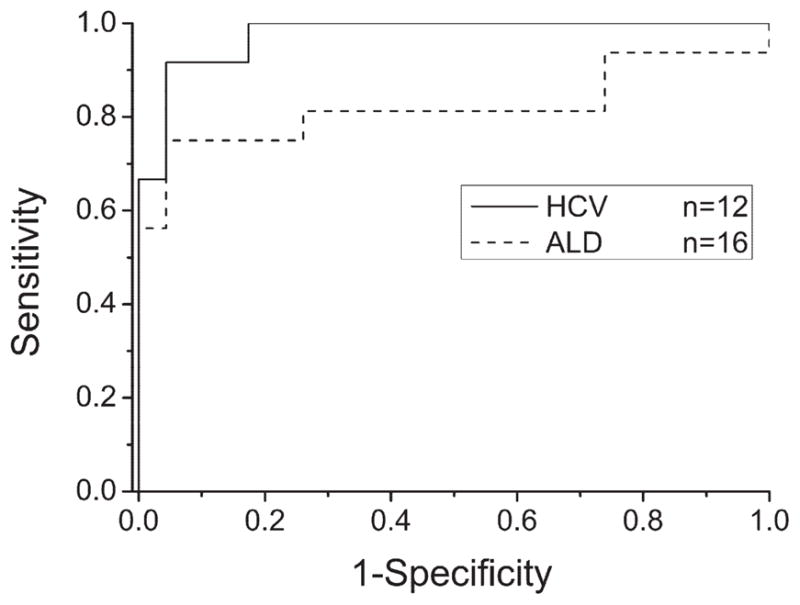
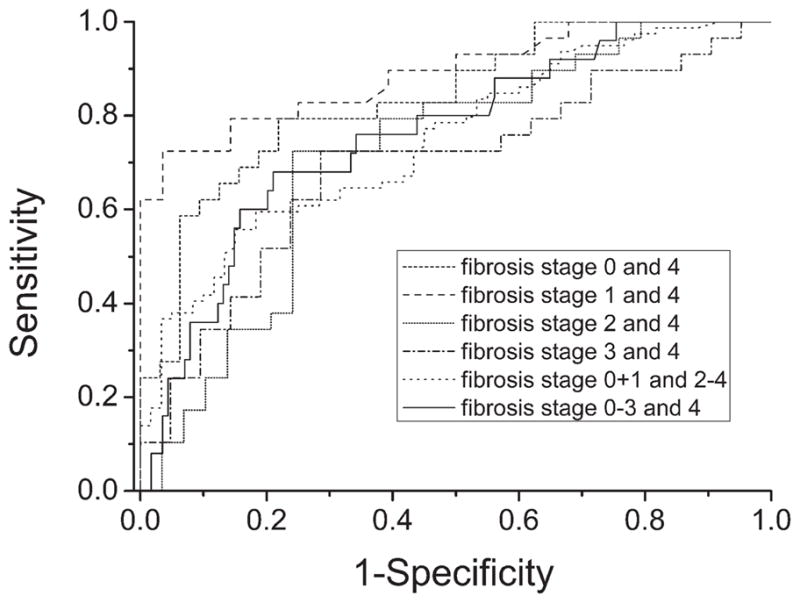
Conclusion: A quantitative analysis of MFAP-4 serum levels in a large number of patients showed MFAP-4 as novel candidate biomarker with high diagnostic accuracy for prediction of nondiseased liver versus cirrhosis [area under receiver operating characteristic curve (AUC) = 0.97, P < 0.0001] as well as stage 0 versus stage 4 fibrosis (AUC = 0.84, P < 0.0001), and stages 0 to 3 versus stage 4 fibrosis (AUC = 0.76, P < 0.0001).
Conflict of interest statement
Potential conflict of interest: Dr. Reiser is a consultant for Gerson Lehrman and Medacorp.
Figures


Similar articles
-
Evaluation of serum procollagen C-proteinase enhancer 1 level as a fibrosis marker in patients with chronic hepatitis B.Eur J Gastroenterol Hepatol. 2018 Aug;30(8):918-924. doi: 10.1097/MEG.0000000000001123. Eur J Gastroenterol Hepatol. 2018. PMID: 29683980
-
Evaluation of the biomarker candidate MFAP4 for non-invasive assessment of hepatic fibrosis in hepatitis C patients.J Transl Med. 2016 Jul 4;14(1):201. doi: 10.1186/s12967-016-0952-3. J Transl Med. 2016. PMID: 27378383 Free PMC article.
-
Analysis of disease-associated protein expression using quantitative proteomics—fibulin-5 is expressed in association with hepatic fibrosis.J Proteome Res. 2015 May 1;14(5):2278-86. doi: 10.1021/acs.jproteome.5b00053. Epub 2015 Apr 6. J Proteome Res. 2015. PMID: 25807371
-
The Clinical Significance of GP73 in Immunologically Mediated Chronic Liver Diseases: Experimental Data and Literature Review.Clin Rev Allergy Immunol. 2018 Apr;54(2):282-294. doi: 10.1007/s12016-017-8655-y. Clin Rev Allergy Immunol. 2018. PMID: 29256057 Review.
-
Mac-2 binding protein glycan isomer (M2BPGi) is a new serum biomarker for assessing liver fibrosis: more than a biomarker of liver fibrosis.J Gastroenterol. 2018 Jul;53(7):819-826. doi: 10.1007/s00535-017-1425-z. Epub 2018 Jan 9. J Gastroenterol. 2018. PMID: 29318378 Review.
Cited by
-
miR-29c is downregulated in renal interstitial fibrosis in humans and rats and restored by HIF-α activation.Am J Physiol Renal Physiol. 2013 May 15;304(10):F1274-82. doi: 10.1152/ajprenal.00287.2012. Epub 2013 Mar 6. Am J Physiol Renal Physiol. 2013. PMID: 23467423 Free PMC article.
-
Corrigendum to 'Level of MFAP4 in ascites independently predicts 1-year transplant-free survival in patients with cirrhosis' [JHEP Reports 3 (2021) 100287].JHEP Rep. 2021 Aug 27;3(5):100353. doi: 10.1016/j.jhepr.2021.100353. eCollection 2021 Oct. JHEP Rep. 2021. PMID: 34693237 Free PMC article.
-
Plasma microfibrillar-associated protein 4 is not prognostic of emphysema progression but is associated with cardiovascular disease history and mortality in COPD patients.ERJ Open Res. 2019 Apr 15;5(2):00021-2019. doi: 10.1183/23120541.00021-2019. eCollection 2019 Apr. ERJ Open Res. 2019. PMID: 31024964 Free PMC article.
-
Pathological investigations and correlation research of microfibrillar-associated protein 4 and tropoelastin in oral submucous fibrosis.BMC Oral Health. 2021 Nov 19;21(1):588. doi: 10.1186/s12903-021-01962-w. BMC Oral Health. 2021. PMID: 34798886 Free PMC article.
-
Non-invasive markers for hepatic fibrosis.BMC Gastroenterol. 2011 Aug 17;11:91. doi: 10.1186/1471-230X-11-91. BMC Gastroenterol. 2011. PMID: 21849046 Free PMC article. Review.
References
-
- Minino AM, Heron MP, Murphy SL, Kochanek KD. Deaths: final data for 2004. Nat Vital Stat Rep. 2007;55:1–119. - PubMed
-
- Dufour DR. Assessment of liver fibrosis: can serum become the sample of choice? Clin Chem. 2005;51:1763–1764. - PubMed
-
- Wasley A, Alter MJ. Epidemiology of hepatitis C: geographic differences and temporal trends. Semin Liver Dis. 2000;20:1–16. - PubMed
Publication types
MeSH terms
Substances
Grants and funding
LinkOut - more resources
Full Text Sources
Other Literature Sources
Medical
Miscellaneous