. 2009 Feb 1;81(3):1162-8.
doi: 10.1021/ac802579z.

Microfluidic perfusion system for automated delivery of temporal gradients to islets of Langerhans

Affiliations

Microfluidic perfusion system for automated delivery of temporal gradients to islets of Langerhans

Xinyu Zhang et al. Anal Chem. .

Abstract

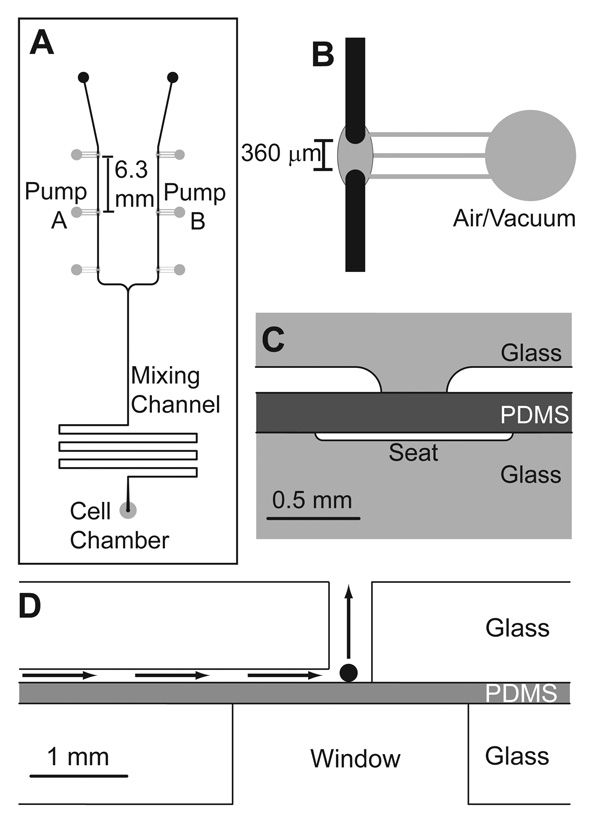
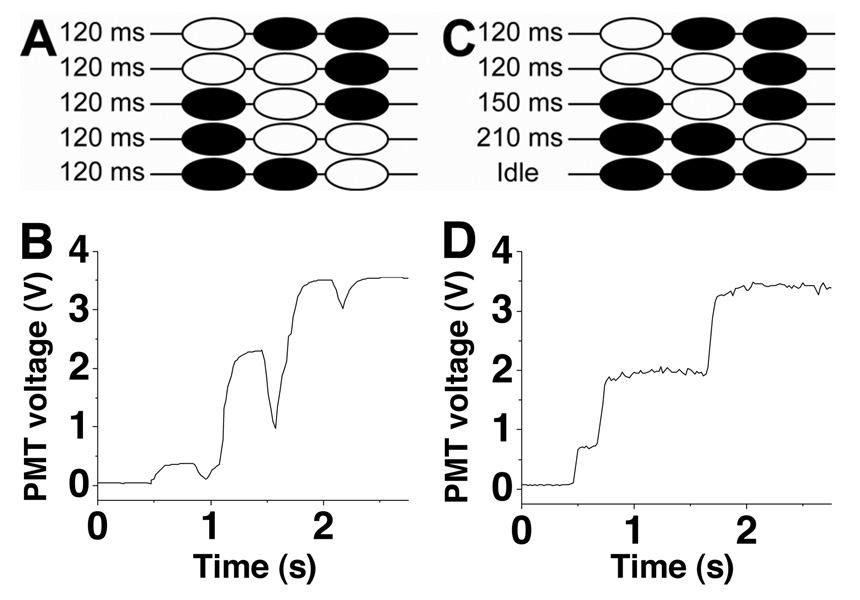
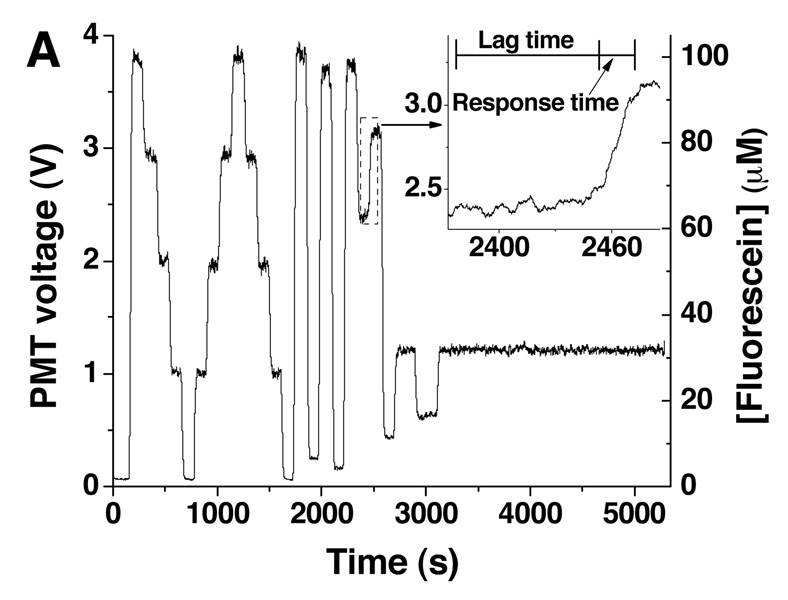
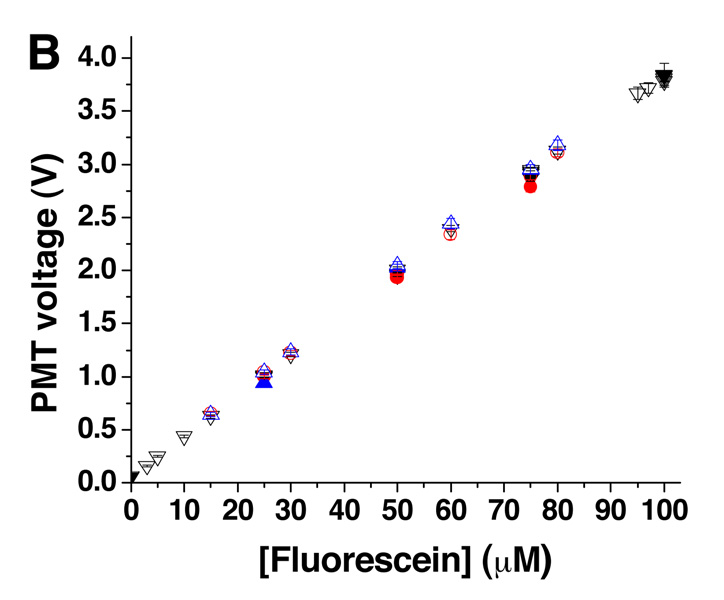
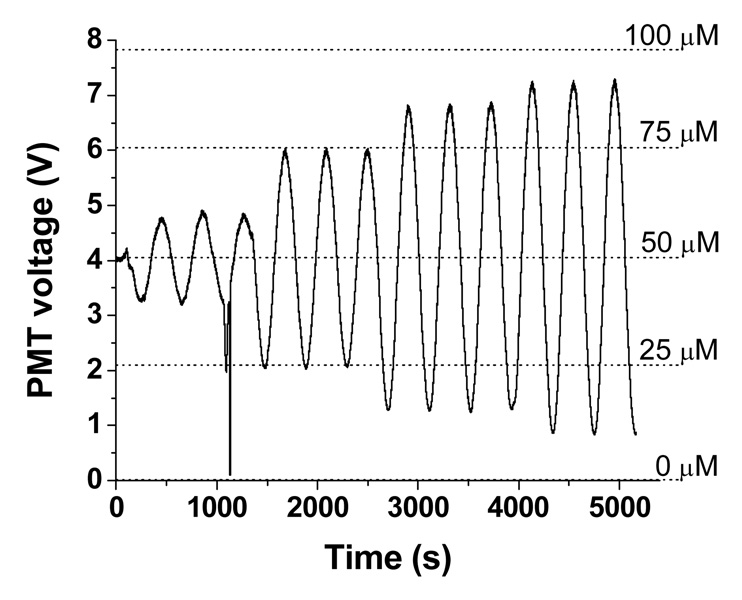
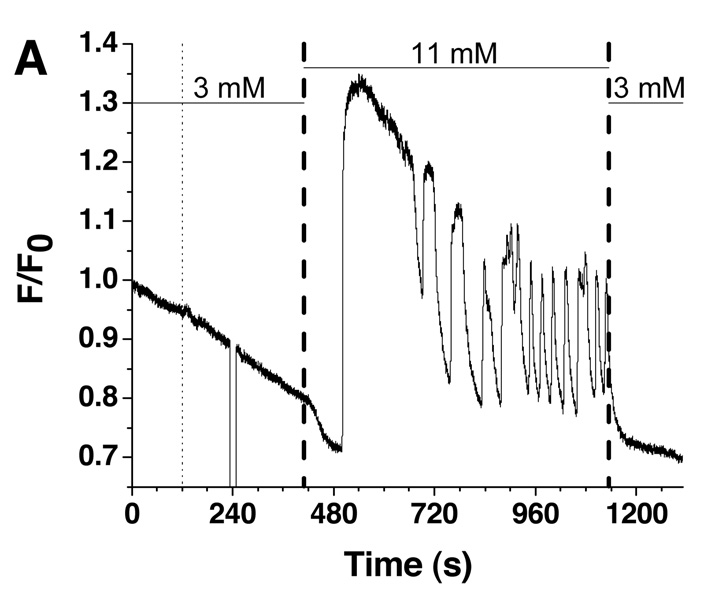
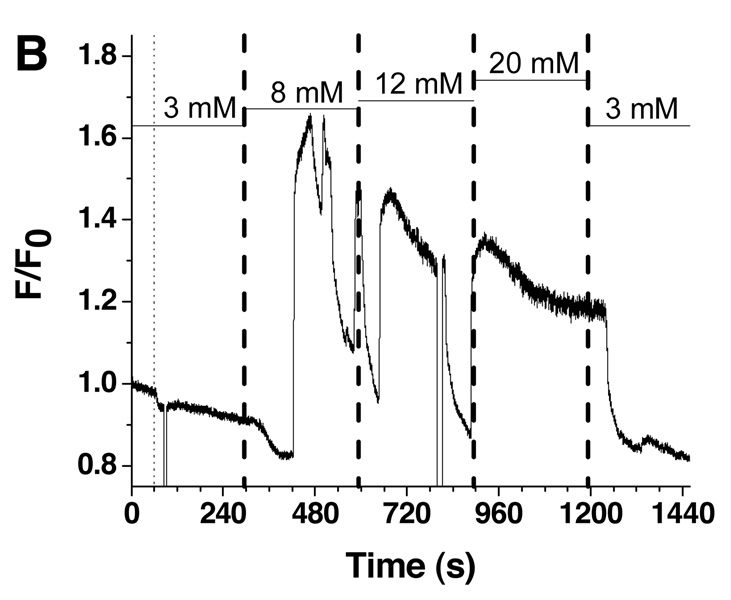
A microfluidic perfusion system was developed for automated delivery of stimulant waveforms to cells within the device. The 3-layer glass/polymer device contained two pneumatic pumps, a 12 cm mixing channel, and a 0.2 microL cell chamber. By altering the flow rate ratio of the pumps, a series of output concentrations could be produced while a constant 1.43 +/- 0.07 microL/min flow rate was maintained. The output concentrations could be changed in time producing step gradients and other waveforms, such as sine and triangle waves, at different amplitudes and frequencies. Waveforms were analyzed by comparing the amplitude of output waveforms to the amplitude of theoretical waveforms. Below a frequency of 0.0098 Hz, the output waveforms had less than 20% difference than input waveforms. To reduce backflow of solutions into the pumps, the operational sequence of the valving program was modified, as well as differential etching of the valve seat depths. These modifications reduced backflow to the point that it was not detected. Gradients in glucose levels were applied in this work to stimulate single islets of Langerhans. Glucose gradients between 3 and 20 mM brought clear and intense oscillations of intracellular [Ca(2+)] indicating the system will be useful in future studies of cellular physiology.


Figures

Figure 1
Figure 1. Microfluidic perfusion system
A. Top view of the microfluidic design used in the experiments. Pump A and B were operated at varying flow rate ratios to deliver varying concentrations of a stimulant and a diluent, respectively, into a mixing channel while maintaining a constant total flow rate. The valving channels are shown in grey and were fabricated in the bottom piece of the 3-layer device. Fluid channels are shown in black and fabricated in the top layer. B. A zoomed-in view of a valve. The discontinuous region of the fluid channel was 360 µm after etching. C. Side view of the valve in the 3-layer device. Vacuum or air was applied to the valve seats, which pushed and pulled the PDMS layer, respectively, opening and closing the valve. D. Side view of the cell chamber. The black sphere is representative of a 100 µm diameter islet of Langerhans within the 300 mm diameter cell chamber. The perfusion direction is given by the arrows. The window below the islet facilitated fluorescence monitoring of intracellular Ca2+ changes. All figures are drawn to scale.
Figure 2
Figure 2. Reduction of backflow
A. Valving sequence using the original sequence of opening and closing the valves (from reference 25). White and black valves indicate open and closed valves, respectively. B. Using the valving sequence described in A, the fluorescence intensity of fluorescein was pumped through the detection region. Decreases at 1 s, 1.6 s, and 2.1 s were due to backflow. C. The new pumping sequence shown with the same coloring scheme as in A. D. Using the valving sequence described in C, the fluorescence from fluorescein pumped through the detection region is shown.
Figure 3
Figure 3. Online-mixing of fluorescein
A. Online mixing of 100 µM fluorescein was performed to produce final concentrations of 0, 25, 50, 75, and 100 µM fluorescein (n = 3) followed by dilutions to 3, 5, 10, 15, 30, 60, 80, 95, and 97 µM. The inset shows the time course of the change from 60 to 80 µM. The times corresponding to the lag and response time are indicated. B. Average PMT readings for each of the different online-mixed concentrations (open symbols) were plotted against the intended final concentration. Offline-mixed fluorescein solutions at concentrations of 0, 25, 50, 75, and 100 µM are plotted on the same graph (closed symbols). Shown on this graph are the results of three assemblies of the microfluidic device and PMMA manifold corresponding to black, blue, and red symbols.
Figure 4
Figure 4. Continuous gradient generation
Sine waves were generated at 0.00245 Hz with amplitudes of 10%, 25%, 35%, and 40%. The 5 dashed lines show the fluorescence intensities of standard solutions of 0, 25, 50, 75, and 100 µM fluorescein.
Figure 5
Figure 5. Single islet [Ca2+]i responses to glucose stimulation
A. Fluo-4 fluorescence from a single islet was measured as a function of time in response to a single step change in glucose concentration. The glucose concentration in the perfusion system was changed as shown by the horizontal bars above the fluorescence trace. The thin dashed line represents the time the pumping commenced while the thick dashed line indicates the time the glucose entered the cell chamber as estimated by the average flow rate and response time of the system. The error in the flow rate and response time measurements is shown by the thickness of the dashed lines. B. A second glucose waveform was applied in steps from 3, 8, 12, 20, and back to 3 mM.

Similar articles

Cited by

References

    1. Tornheim K. Diabetes. 1997;46:1375–1380. - PubMed
    1. Kennedy RT, Kauri LM, Dahlgren GM, Jung S-K. Diabetes. 2002;51:152–161. - PubMed
    1. Longo EA, Tornheim K, Deeney JT, Varnum BA, Tillotson D, Prentki M, Corkey BE. J. Biol. Chem. 1991;266:9314–9319. - PubMed
    1. Jung S-K, Aspinwall CA, Kennedy RT. Biochem. Biophys. Res. Commun. 1999;259:331–335. - PubMed
    1. Henquin J-C. Diabetes. 2000;49:1751–1760. - PubMed

Publication types