

Impact of genotyping errors on the type I error rate and the power of haplotype-based association methods
- PMID: 19178712
- PMCID: PMC2648998
- DOI: 10.1186/1471-2156-10-3
Impact of genotyping errors on the type I error rate and the power of haplotype-based association methods
Abstract
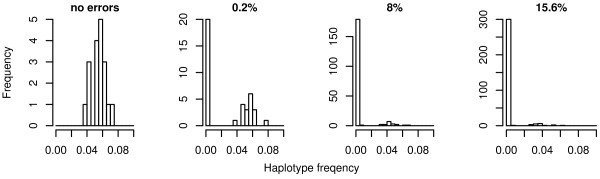
Background: We investigated the influence of genotyping errors on the type I error rate and empirical power of two haplotype based association methods applied to candidate regions. We compared the performance of the Mantel Statistic Using Haplotype Sharing and the haplotype frequency based score test with that of the Armitage trend test.Our study is based on 1000 replication of simulated case-control data settings with 500 cases and 500 controls, respectively. One of the examined markers was set to be the disease locus with a simulated odds ratio of 3. Differential and non-differential genotyping errors were introduced following a misclassification model with varying mean error rates per locus in the range of 0.2% to 15.6%.
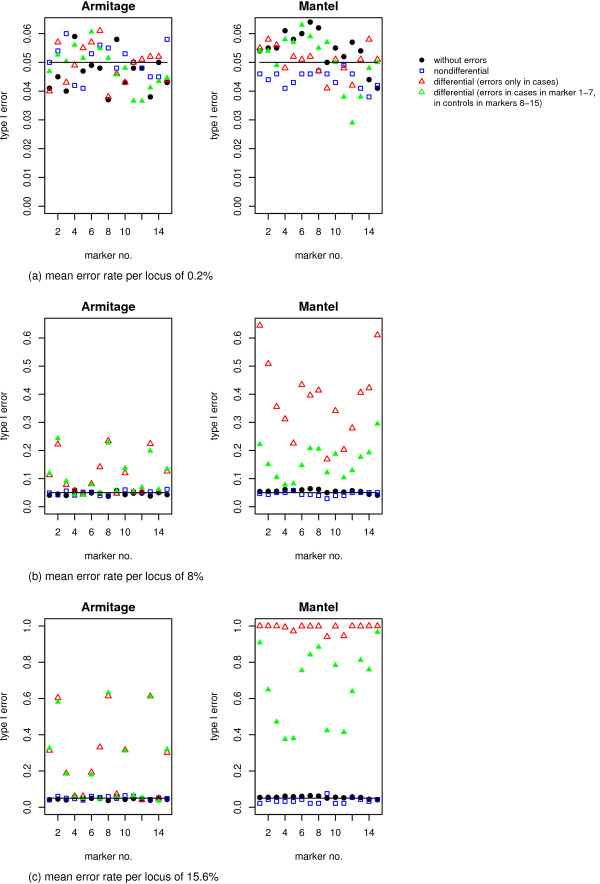
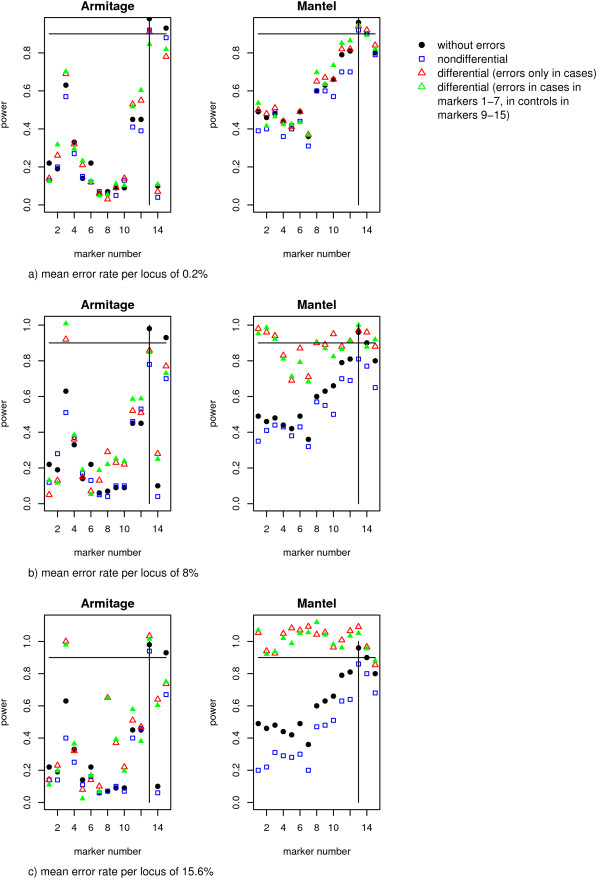
Results: We found that the type I error rate of all three test statistics hold the nominal significance level in the presence of non-differential genotyping errors and low error rates. For high and differential error rates, the type I error rate of all three test statistics was inflated, even when genetic markers not in Hardy-Weinberg Equilibrium were removed. The empirical power of all three association test statistics remained high at around 89% to 94% when genotyping error rates were low, but decreased to 48% to 80% for high and non-differential genotyping error rates.
Conclusion: Currently realistic genotyping error rates for candidate gene analysis (mean error rate per locus of 0.2%) pose no significant problem for the type I error rate as well as the power of all three investigated test statistics.
Figures

Similar articles
-
Susceptibility of biallelic haplotype and genotype frequencies to genotyping error.Biometrics. 2006 Dec;62(4):1116-23. doi: 10.1111/j.1541-0420.2006.00563.x. Biometrics. 2006. PMID: 17156286
-
Quantifying bias due to allele misclassification in case-control studies of haplotypes.Genet Epidemiol. 2006 Nov;30(7):590-601. doi: 10.1002/gepi.20170. Genet Epidemiol. 2006. PMID: 16830341
-
Assessing the impact of differential genotyping errors on rare variant tests of association.PLoS One. 2013;8(3):e56626. doi: 10.1371/journal.pone.0056626. Epub 2013 Mar 5. PLoS One. 2013. PMID: 23472072 Free PMC article.
-
Haplotype sharing transmission/disequilibrium tests that allow for genotyping errors.Genet Epidemiol. 2005 May;28(4):341-51. doi: 10.1002/gepi.20066. Genet Epidemiol. 2005. PMID: 15662724
-
Quantification of the power of Hardy-Weinberg equilibrium testing to detect genotyping error.Hum Hered. 2006;61(1):10-4. doi: 10.1159/000091787. Epub 2006 Mar 1. Hum Hered. 2006. PMID: 16514241
Cited by
-
Analyses and comparison of imputation-based association methods.PLoS One. 2010 May 26;5(5):e10827. doi: 10.1371/journal.pone.0010827. PLoS One. 2010. PMID: 20520814 Free PMC article.
-
Marker genotyping error effects on genomic predictions under different genetic architectures.Mol Genet Genomics. 2021 Jan;296(1):79-89. doi: 10.1007/s00438-020-01728-z. Epub 2020 Sep 29. Mol Genet Genomics. 2021. PMID: 32995954
-
An Analytic Solution to the Computation of Power and Sample Size for Genetic Association Studies under a Pleiotropic Mode of Inheritance.Hum Hered. 2016;81(4):194-209. doi: 10.1159/000457135. Epub 2017 Mar 18. Hum Hered. 2016. PMID: 28315880 Free PMC article.
-
A simple and fast two-locus quality control test to detect false positives due to batch effects in genome-wide association studies.Genet Epidemiol. 2010 Dec;34(8):854-62. doi: 10.1002/gepi.20541. Genet Epidemiol. 2010. PMID: 21104888 Free PMC article.
-
Single-variant and multi-variant trend tests for genetic association with next-generation sequencing that are robust to sequencing error.Hum Hered. 2012;74(3-4):172-83. doi: 10.1159/000346824. Epub 2013 Apr 11. Hum Hered. 2012. PMID: 23594495 Free PMC article.
References
-
- Bross I. Misclassification in 2 × 2 tables. Biometrics. 1954;10:478–486. doi: 10.2307/3001619. - DOI
-
- Heid IM, Lamina C, Bongardt F, Fischer G, Klopp N, Huth C, Küchenhoff H, Kronenberg F, Wichmann HE, Illig T. Wie gut können Haplotypen in den populationsbasierten KORA-Studien rekonstruiert werden? Gesundheitswesen. 2005;67:S132–S136. - PubMed
Publication types
MeSH terms
Substances
LinkOut - more resources
Full Text Sources
