. 2009 Feb 10;106(6):1704-9.
doi: 10.1073/pnas.0812721106. Epub 2009 Jan 28.

Irreversible climate change due to carbon dioxide emissions

Affiliations

Irreversible climate change due to carbon dioxide emissions

Susan Solomon et al. Proc Natl Acad Sci U S A. .

Abstract

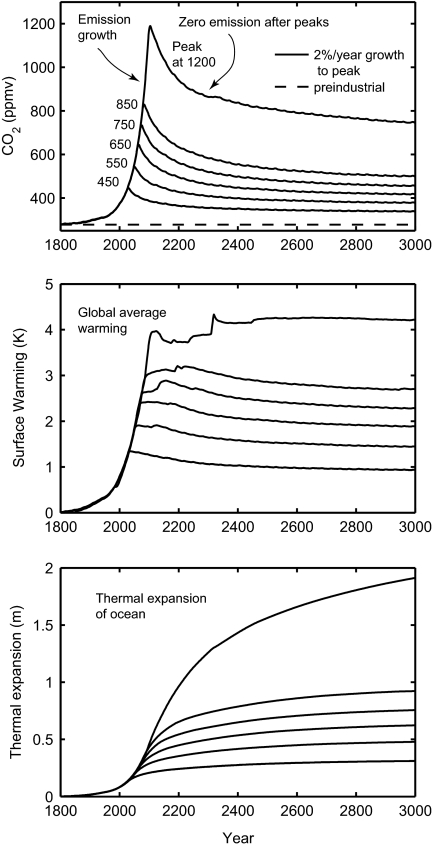
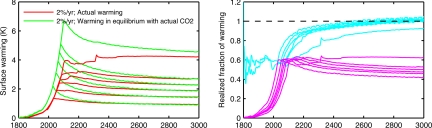
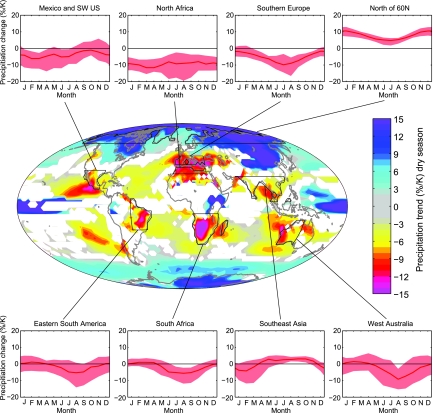
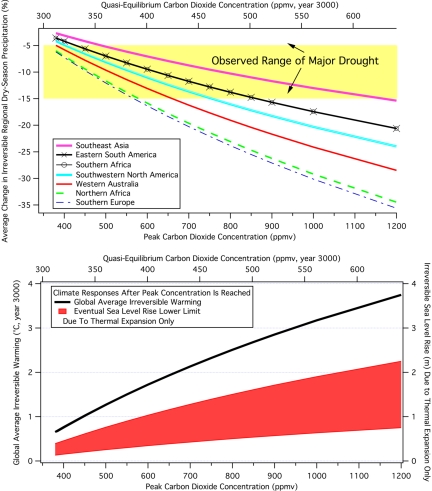
The severity of damaging human-induced climate change depends not only on the magnitude of the change but also on the potential for irreversibility. This paper shows that the climate change that takes place due to increases in carbon dioxide concentration is largely irreversible for 1,000 years after emissions stop. Following cessation of emissions, removal of atmospheric carbon dioxide decreases radiative forcing, but is largely compensated by slower loss of heat to the ocean, so that atmospheric temperatures do not drop significantly for at least 1,000 years. Among illustrative irreversible impacts that should be expected if atmospheric carbon dioxide concentrations increase from current levels near 385 parts per million by volume (ppmv) to a peak of 450-600 ppmv over the coming century are irreversible dry-season rainfall reductions in several regions comparable to those of the "dust bowl" era and inexorable sea level rise. Thermal expansion of the warming ocean provides a conservative lower limit to irreversible global average sea level rise of at least 0.4-1.0 m if 21st century CO(2) concentrations exceed 600 ppmv and 0.6-1.9 m for peak CO(2) concentrations exceeding approximately 1,000 ppmv. Additional contributions from glaciers and ice sheet contributions to future sea level rise are uncertain but may equal or exceed several meters over the next millennium or longer.


Conflict of interest statement

The authors declare no conflict of interest.

Figures

Fig. 1.
Fig. 1.
Carbon dioxide and global mean climate system changes (relative to preindustrial conditions in 1765) from 1 illustrative model, the Bern 2.5CC EMIC, whose results are comparable to the suite of assessed EMICs (5, 7). Climate system responses are shown for a ramp of CO2 emissions at a rate of 2%/year to peak CO2 values of 450, 550, 650, 750, 850, and 1200 ppmv, followed by zero emissions. The rate of global fossil fuel CO2 emission grew at ≈1%/year from 1980 to 2000 and >3%/year in the period from 2000 to 2005 (13). Results have been smoothed using an 11-year running mean. The 31-year variation seen in the carbon dioxide time series is introduced by the climatology used to force the terrestrial biosphere model (15). (Top) Falloff of CO2 concentrations following zero emissions after the peak. (Middle) Globally averaged surface warming (degrees Celsius) for these cases (note that this model has an equilibrium climate sensitivity of 3.2 °C for carbon dioxide doubling). Warming over land is expected to be larger than these global averaged values, with the greatest warming expected in the Arctic (5). (Bottom) Sea level rise (meters) from thermal expansion only (not including loss of glaciers, ice caps, or ice sheets).
Fig. 2.
Fig. 2.
Comparison between calculated time-dependent surface warming in the Bern2.5CC model and the values that would be expected if temperatures were in equilibrium with respect to the CO2 enhancements, illustrative of 2%/year emission increases to 450, 550, 650, 750, 850, and 1,200 ppmv as in Fig. 1. (Left) The actual and equilibrium temperature changes (based upon the model's climate sensitivity at equilibrium). The cyan lines in Right show the ratio of actual and equilibrium temperatures (or realized fraction of the warming for the time-dependent CO2 concentrations), while the magenta lines show the ratio of actual warming to the equilibrium temperature for the peak CO2 concentration.
Fig. 3.
Fig. 3.
Expected decadally averaged changes in the global distribution of precipitation per degree of warming (percentage of change in precipitation per degree of warming, relative to 1900–1950 as the baseline period) in the dry season at each grid point, based upon a suite of 22 AOGCMs for a midrange future scenario (A1B, see ref. 5). White is used where fewer than 16 of 22 models agree on the sign of the change. Data are monthly averaged over several broad regions in Inset plots. Red lines show the best estimate (median) of the changes in these regions, while the red shading indicates the ±1-σ likely range (i.e., 2 of 3 chances) across the models.
Fig. 4.
Fig. 4.
Illustrative irreversible climate changes as a function of peak carbon dioxide reached. (Upper) Best estimate of expected irreversible dry-season precipitation changes for the regions shown in Fig. 3, as a function of the peak carbon dioxide concentration during the 21st century. The quasi-equilibrium CO2 concentrations shown correspond to 40% remaining in the long term as discussed in the text. The precipitation change per degree is derived for each region as in Fig. 3; see also Fig. S3. The yellow box indicates the range of precipitation change observed during typical major regional droughts such as the “dust bowl” in North America (32). (Lower) Corresponding irreversible global warming (black line). Also shown is the associated lower limit of irreversible sea level rise (because of thermal expansion only based upon a range of 0.2–0.6 m/°C), from an assessment across available models (5). Smaller values (by ≈30%) for expected warming, precipitation, and thermal sea level rise would be obtained if climate sensitivity is smaller than the best estimate while larger values (by ≈50%) would be expected for the upper end of the estimated likely range of climate sensitivity (49).

References

    1. Hansen J, et al. Dangerous human-made interference with climate: a GISS modelE study. Atmos Chem Phys. 2007;7:2287–2312.
    1. Ramanathan V, Feng Y. On avoiding dangerous anthropogenic interference with the climate system: formidable challenges. Proc Natl Acad Sci USA. 2008;105:14245–14250. - PMC - PubMed
    1. Schellnhuber HJ. Global warming: Stop worrying, start panicking? Proc Natl Acad Sci USA. 2008;105:14239–14240. - PMC - PubMed
    1. Oppenheimer M, Alley RB. The West Antarctic ice sheet and long term climate policy. Clim Change. 2004;64:1–10.
    1. Meehl GA, et al. Global climate projections. In: Solomon S, et al., editors. Climate Change 2007: The Physical Science Basis. Cambridge, UK, and New York: Cambridge Univ Press; 2007. pp. 747–845.

Publication types