

Long-term consequences of kidney donation
- PMID: 19179315
- PMCID: PMC3559132
- DOI: 10.1056/NEJMoa0804883
Long-term consequences of kidney donation
Abstract
Background: The long-term renal consequences of kidney donation by a living donor are attracting increased appropriate interest. The overall evidence suggests that living kidney donors have survival similar to that of nondonors and that their risk of end-stage renal disease (ESRD) is not increased. Previous studies have included relatively small numbers of donors and a brief follow-up period.
Methods: We ascertained the vital status and lifetime risk of ESRD in 3698 kidney donors who donated kidneys during the period from 1963 through 2007; from 2003 through 2007, we also measured the glomerular filtration rate (GFR) and urinary albumin excretion and assessed the prevalence of hypertension, general health status, and quality of life in 255 donors.
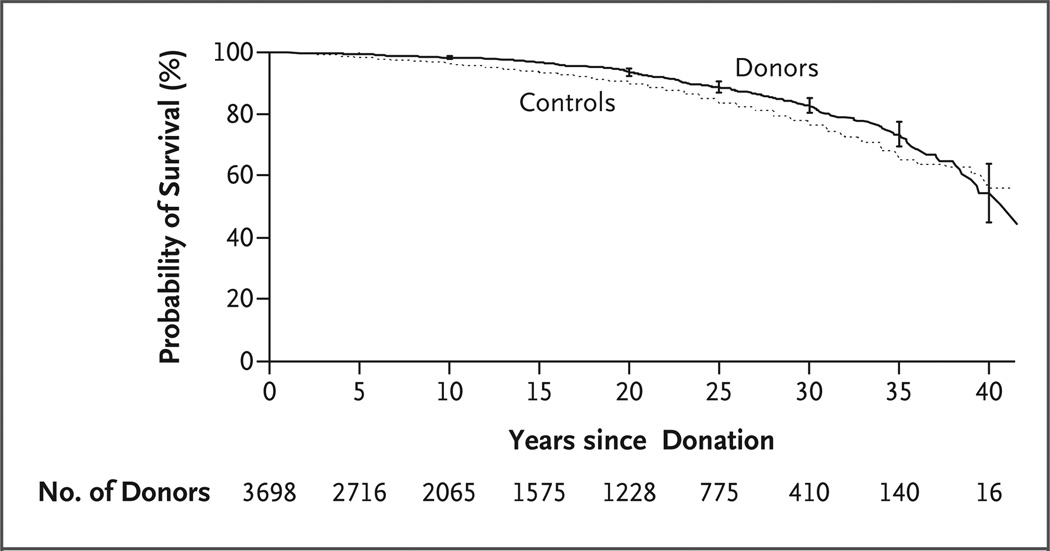
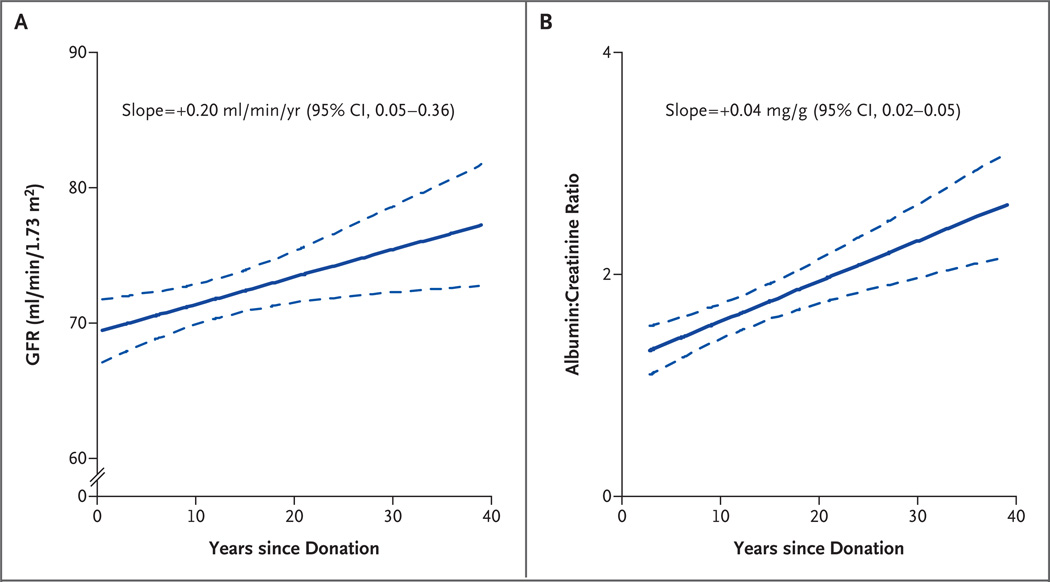
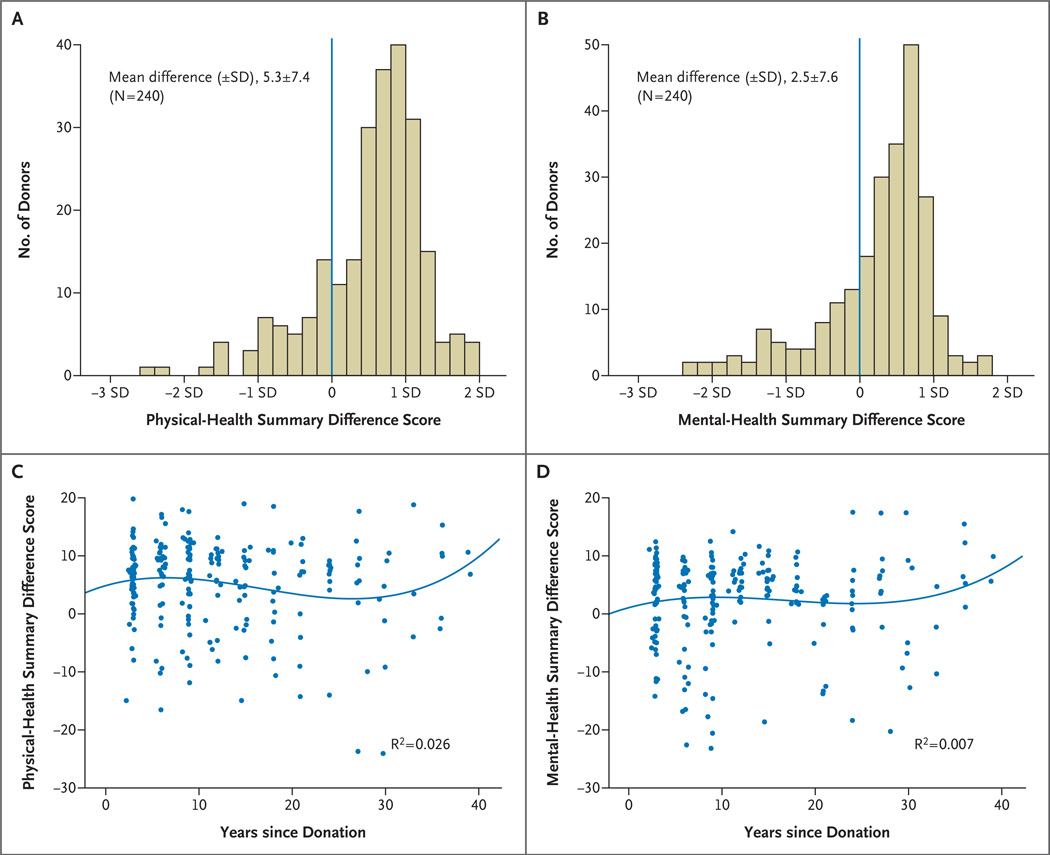
Results: The survival of kidney donors was similar to that of controls who were matched for age, sex, and race or ethnic group. ESRD developed in 11 donors, a rate of 180 cases per million persons per year, as compared with a rate of 268 per million per year in the general population. At a mean (+/-SD) of 12.2+/-9.2 years after donation, 85.5% of the subgroup of 255 donors had a GFR of 60 ml per minute per 1.73 m(2) of body-surface area or higher, 32.1% had hypertension, and 12.7% had albuminuria. Older age and higher body-mass index, but not a longer time since donation, were associated with both a GFR that was lower than 60 ml per minute per 1.73 m(2) and hypertension. A longer time since donation, however, was independently associated with albuminuria. Most donors had quality-of-life scores that were better than population norms, and the prevalence of coexisting conditions was similar to that among controls from the National Health and Nutrition Examination Survey (NHANES) who were matched for age, sex, race or ethnic group, and body-mass index.
Conclusions: Survival and the risk of ESRD in carefully screened kidney donors appear to be similar to those in the general population. Most donors who were studied had a preserved GFR, normal albumin excretion, and an excellent quality of life.
2009 Massachusetts Medical Society
Conflict of interest statement
No other potential conflict of interest relevant to this article was reported.
Figures
Comment in
-
Cautious optimism concerning long-term safety of kidney donation.N Engl J Med. 2009 Jan 29;360(5):522-3. doi: 10.1056/NEJMe0810193. N Engl J Med. 2009. PMID: 19179321 No abstract available.
-
Long-term consequences of kidney donation.N Engl J Med. 2009 May 28;360(22):2370; author reply 2372. doi: 10.1056/NEJMc090444. N Engl J Med. 2009. PMID: 19474439 No abstract available.
-
Long-term consequences of kidney donation.N Engl J Med. 2009 May 28;360(22):2370-1; author reply 2372. N Engl J Med. 2009. PMID: 19484819 No abstract available.
-
Long-term consequences of kidney donation.N Engl J Med. 2009 May 28;360(22):2371-2; author reply 2372. N Engl J Med. 2009. PMID: 19484820 No abstract available.
-
Long-term consequences of kidney donation.N Engl J Med. 2009 May 28;360(22):2371; author reply 2372. N Engl J Med. 2009. PMID: 19484821 No abstract available.
-
Mortality among living kidney donors and comparison populations.N Engl J Med. 2010 Aug 19;363(8):797-8. doi: 10.1056/NEJMc1002100. N Engl J Med. 2010. PMID: 20818884 No abstract available.
References
-
- U.S. Renal Data System. USRDS 2007 annual data report: atlas of chronic kidney disease and end-stage renal disease in the United States. Bethesda, MD: National Institutes of Health, National Institute of Diabetes and Digestive and Kidney Diseases; 2007.
-
- The Organ Procurement and Transplantation Network. [Accessed January 5, 2009];United Network for Organ Sharing (UNOS) (at http://www.optn.org.)
-
- Fehrman-Ekholm I, Elinder G, Stenbeck M, Tydén G, Groth C. Kidney donors live longer. Transplantation. 1997;64:976–978. - PubMed
-
- Ellison MD, McBride MA, Taranto SE, Delmonico FL, Kauffman HM. Living kidney donors in need of kidney transplants: a report from the Organ Procurement and Transplantation Network. Transplantation. 2002;74:1349–1351. - PubMed
-
- Gibney EM, King AL, Maluf DG, Garg AX, Parikh CR. Living kidney donors requiring transplantation: focus on African Americans. Transplantation. 2007;84:647–649. - PubMed
Publication types
MeSH terms
Substances
Grants and funding
LinkOut - more resources
Full Text Sources
Other Literature Sources
Medical