. 2009 May;329(2):558-70.
doi: 10.1124/jpet.108.149831. Epub 2009 Jan 29.

Expression profiling of the solute carrier gene family in the mouse brain

Affiliations

Expression profiling of the solute carrier gene family in the mouse brain

Amber Dahlin et al. J Pharmacol Exp Ther. 2009 May.

Abstract

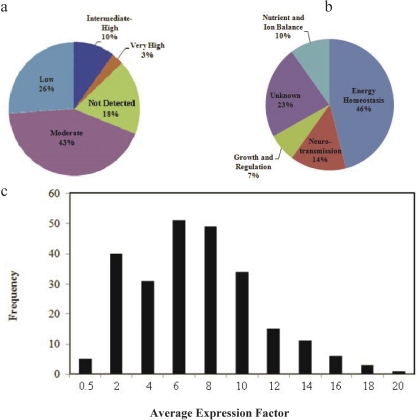
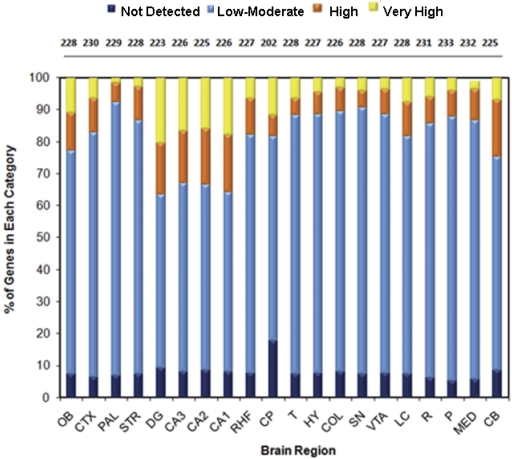
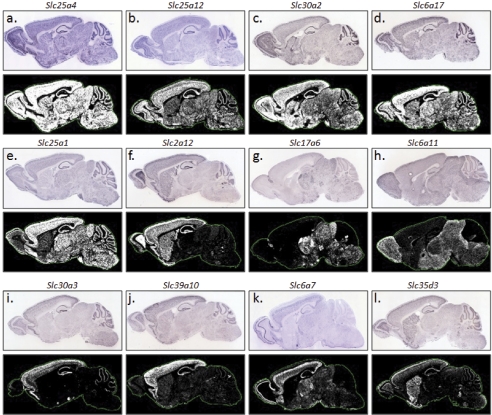
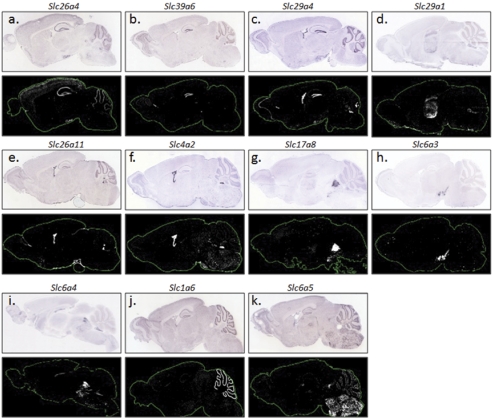
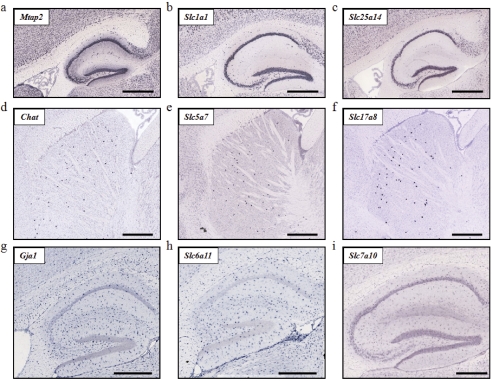
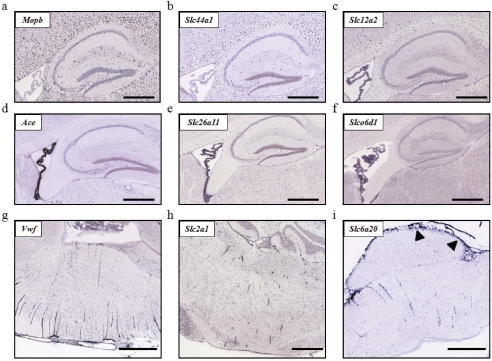
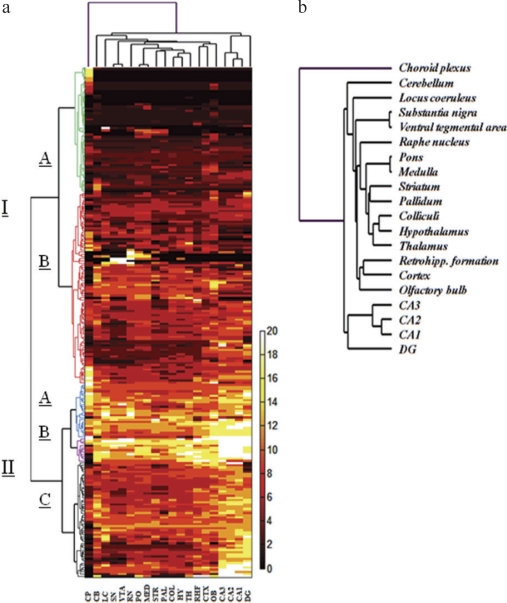
The solute carrier (Slc) superfamily is a major group of membrane transport proteins present in mammalian cells. Although Slc transporters play essential and diverse roles in the central nervous system, the localization and function of the vast majority of Slc genes in the mammalian brain are largely unknown. Using high-throughput in situ hybridization data generated by the Allen Brain Atlas, we systematically and quantitatively analyzed the spatial and cellular distribution of 307 Slc genes, which represent nearly 90% of presently known mouse Slc genes, in the adult C57BL/6J mouse brain. Our analysis showed that 252 (82%) of the 307 Slc genes are present in the brain, and a large proportion of these genes were detected at low to moderate expression levels. Evaluation of 20 anatomical brain subdivisions demonstrated a comparable level of Slc gene complexity but significant difference in transcript enrichment. The distribution of the expressed Slc genes was diverse, ranging from near-ubiquitous to highly localized. Functional annotation in 20 brain regions, including the blood-brain and blood-cerebral spinal fluid (CSF) barriers, suggests major roles of Slc transporters in supporting brain energy utilization, neurotransmission, nutrient supply, and CSF production. Furthermore, hierarchical cluster analysis revealed intricate Slc expression patterns associated with neuroanatomical organization. Our studies also revealed Slc genes present within defined brain microstructures and described the putative cell types expressing individual Slc genes. These results provide a useful resource for investigators to explore the roles of Slc genes in neurophysiological and pathological processes.


Figures

Fig. 1.
Fig. 1.
Global expression of Slc transcripts in the mouse brain. a, pie chart shows the percentage of Slc genes in five expression categories based upon their average expression factor values (Ê) across the brain. Based onÊ values, five expression categories were assigned: not detected (Ê = 0), low (0 < Ê < 4), moderate (4 ≤Ê < 10), intermediate to high (10 ≤Ê < 14), and very high (E ≥14). b, pie chart displays the functional categories of Slc genes with detectable expression in the brain (Ê > 0). c, histogram shows the distribution of average expression factor values of Slc genes expressed in the brain.
Fig. 2.
Fig. 2.
Gene diversity and distribution of expression factor in individual brain regions. The numbers above each bar indicate the total number of genes present (E > 0) in the corresponding brain region. The percentage of Slc genes within each expression factor category, indicated by color-coded bars [dark blue, not detected (E = 0); light blue, low to moderate (0 < E ≤ 9); orange, intermediate to high (9 < E ≤ 13); yellow, very high (13 < E ≤20)] for each brain area is shown on the y-axis. Labels on x-axis correspond to brain regions: OB, olfactory bulb; CTX, cerebral cortex; PAL, pallidum; STR, striatum; DG, dentate gyrus; CA3, CA3 hippocampal field; CA2, CA2 hippocampal field; CA1, CA1 hippocampal field; RHF, retrohippocampal formation; CP, choroid plexus; T, thalamus; HY, hypothalamus; COL, colliculi; SN, substantia nigra; VTA, ventral tegmental area; LC, locus coeruleus; R, raphe; P, pons; MED, medulla; and CB, cerebellum.
Fig. 3.
Fig. 3.
Examples of expression patterns for ubiquitously and regionally expressed Slc genes. a through e, typical ISH results for ubiquitously and near-ubiquitously expressed genes. Regionally localized Slc genes are shown in f through l. Genes enriched in the cortex are shown in i through l. For each gene, the top represents the ISH image, and the bottom is the expression mask generated from the ISH image.
Fig. 4.
Fig. 4.
Expression patterns observed for some highly localized Slc genes. In the forebrain, genes that are highly localized in the hippocampal formation, dentate gyrus and thalami are shown in a through d. e and f, choroid plexus-enriched genes. Slc genes that were highly localized to the midbrain (g-i), cerebellum (j), and medulla (k) were also observed. For each gene, the top represents the ISH image, and the bottom is the expression mask generated from the ISH image.
Fig. 5.
Fig. 5.
Cellular expression patterns of Slc genes within neurons and astrocytes. Neuron-specific marker Mtap2 (shown in a) was used as a reference for genes with neuronal expression patterns [e.g., Slc1a1 (b) and Slc25a14 (c) in the hippocampus]. The interneuron-restricted Chat [expressed in striatal interneurons in (d)] was used as a marker for genes with interneuron expression [Slc5a7 (e) and Slc17a8 (f) in the striatum]. In h and i, Slc transporters demonstrate cellular expression patterns similar to that of the astrocyte marker, Gja1 (g).
Fig. 6.
Fig. 6.
Cellular expression patterns of Slc genes within oligodendrocytes, choroid plexus epithelia, and brain microvessel endothelial cells. Cell type-specific markers for oligodendrocytes (a), choroid plexus epithelia (d), and brain microvessel endothelia (g) were used to distinguish the cellular expression patterns of Slc genes. Examples of Slc genes expressed in oligodendrocytes (b and c), choroid plexus (e and f), and brain microvessel (h and i) and pia mater membrane [darts (i)] are shown.
Fig. 7.
Fig. 7.
Unsupervised hierarchical cluster analysis (UHCA) of Slc gene expression across the brain. Clustergram shown in a demonstrates results of UHCA of E values for Slc genes. UHCA produced two major clusters (labeled I and II, left), divided into five subclusters (dendrogram is color-coded for ease of identification). Label bar at the right of clustergram indicates the range of color-coded expression factor values presented in the heat map (from 0 to 20). In b, a magnified image of the dendrogram of clustered brain regions [shown as x-axis labels (a)] is shown. OB, olfactory bulb; CTX, cerebral cortex; PAL, pallidum; STR, striatum; DG, dentate gyrus; CA3, CA3 hippocampal field; CA2, CA2 hippocampal field; CA1, CA1 hippocampal field; RHF, retrohippocampal formation; CP, choroid plexus; T, thalamus; HY, hypothalamus; COL, colliculi; SN, substantia nigra; VTA, ventral tegmental area; LC, locus coeruleus; R, raphe; P, pons; MED, medulla; CB, cerebellum.

References

    1. Allen DD and Geldenhuys WJ (2006) Molecular modeling of blood-brain barrier nutrient transporters: in silico basis for evaluation of potential drug delivery to the central nervous system. Life Sci 78 1029-1033. - PubMed
    1. Arriza JL, Eliasof S, Kavanaugh MP, and Amara SG (1997) Excitatory amino acid transporter 5, a retinal glutamate transporter coupled to a chloride conductance. Proc Natl Acad Sci U S A 94 4155-4160. - PMC - PubMed
    1. Bazalakova MH and Blakely RD (2006) The high-affinity choline transporter: a critical protein for sustaining cholinergic signaling as revealed in studies of genetically altered mice. Handb Exp Pharmacol 175 525-544. - PubMed
    1. Beart PM and O'Shea RD (2007) Transporters for l-glutamate: an update on their molecular pharmacology and pathological involvement. Br J Pharmacol 150 5-17. - PMC - PubMed
    1. Bhattacharjee Y (2006) Neuroscience: “Google of the brain”: atlas maps brain's genetic activity. Science 313 1879. - PubMed

Publication types

Substances

LinkOut - more resources