. 2009 Feb 1;69(3):775-84.
doi: 10.1158/0008-5472.CAN-08-0987.

The role of tumor cell-derived connective tissue growth factor (CTGF/CCN2) in pancreatic tumor growth

Affiliations

The role of tumor cell-derived connective tissue growth factor (CTGF/CCN2) in pancreatic tumor growth

Kevin L Bennewith et al. Cancer Res. .

Abstract

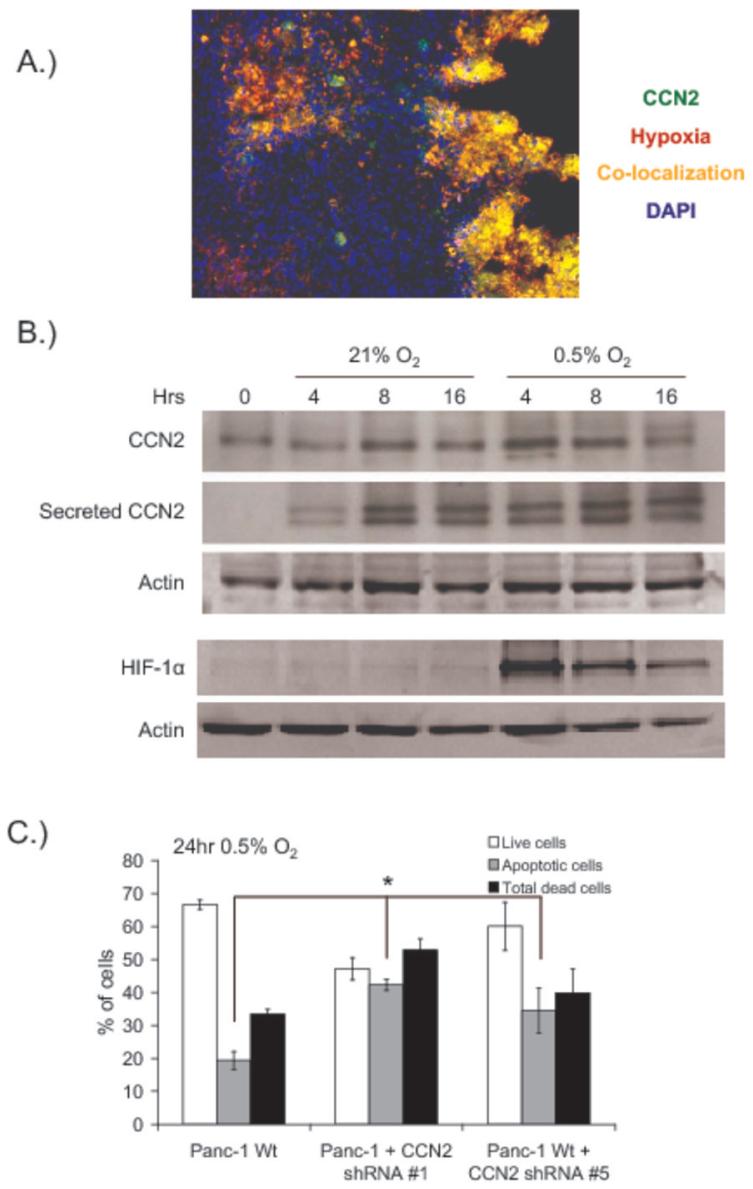
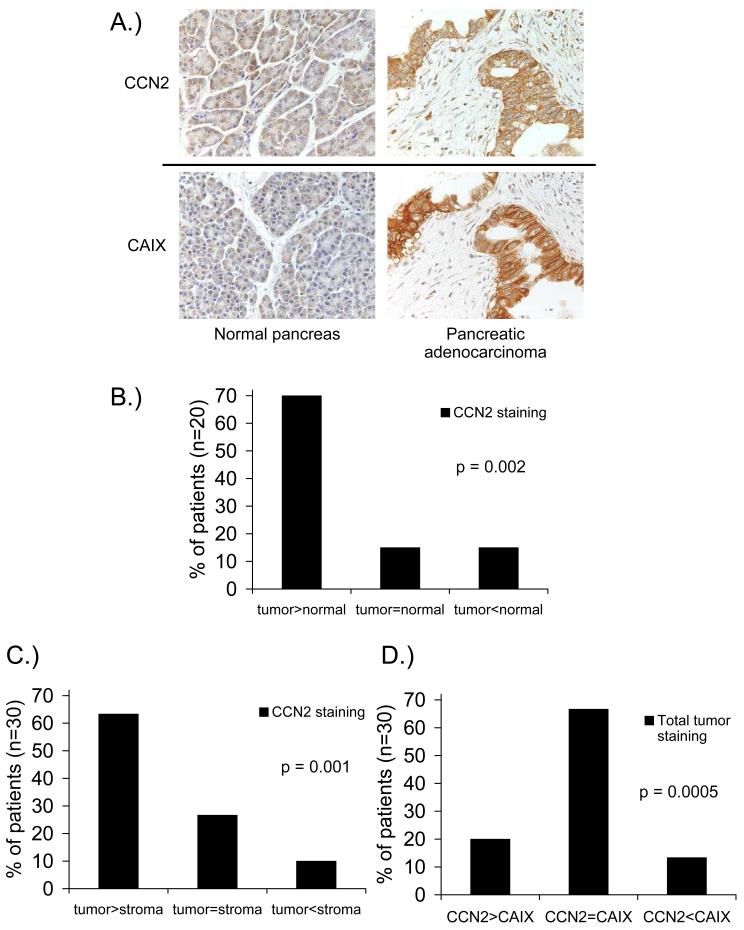
Pancreatic cancer is highly aggressive and refractory to existing therapies. Connective tissue growth factor (CTGF/CCN2) is a fibrosis-related gene that is thought to play a role in pancreatic tumor progression. However, CCN2 can be expressed in a variety of cell types, and the contribution of CCN2 derived from either tumor cells or stromal cells as it affects the growth of pancreatic tumors is unknown. Using genetic inhibition of CCN2, we have discovered that CCN2 derived from tumor cells is a critical regulator of pancreatic tumor growth. Pancreatic tumor cells derived from CCN2 shRNA-expressing clones showed dramatically reduced growth in soft agar and when implanted s.c. We also observed a role for CCN2 in the growth of pancreatic tumors implanted orthotopically, with tumor volume measurements obtained by positron emission tomography imaging. Mechanistically, CCN2 protects cells from hypoxia-mediated apoptosis, providing an in vivo selection for tumor cells that express high levels of CCN2. We found that CCN2 expression and secretion was increased in hypoxic pancreatic tumor cells in vitro, and we observed colocalization of CCN2 and hypoxia in pancreatic tumor xenografts and clinical pancreatic adenocarcinomas. Furthermore, we found increased CCN2 staining in clinical pancreatic tumor tissue relative to stromal cells surrounding the tumor, supporting our assertion that tumor cell-derived CCN2 is important for pancreatic tumor growth. Taken together, these data improve our understanding of the mechanisms responsible for pancreatic tumor growth and progression, and also indicate that CCN2 produced by tumor cells represents a viable therapeutic target for the treatment of pancreatic cancer.


Figures

Figure 1
Figure 1. CCN2 knockdown decreases soft agar growth of pancreatic tumor cells
(A) Upper, Northern blot of total RNA from wild-type Panc-1 cells and Panc-1 cells stably expressing one of six shRNA sequences targeting CCN2 (labeled A-F). Scr = scrambled control shRNA. Lower, Northern blot of Panc-1 cells stably expressing shRNA D and subsequently transfected with CCN2. (B) 105 Panc-1 cells stably expressing the indicated shRNA constructs were plated as monolayers and counted every 4 days. 105 cells were replated after each count and the cumulative cell numbers are plotted. Data are mean ± SEM. (C) 5×10³ Panc-1 cells stably expressing the indicated shRNA constructs were plated in soft agar and allowed to grow for 2-3 weeks. Colonies were stained with Giemsa stain for visualization and representative images are shown. (D) Quantification of the soft agar colonies from (C). Data are mean ± SEM; *p<0.05 relative to control.
Figure 2
Figure 2. Partial knockdown of CCN2 induces modest delays in subcutaneous pancreatic tumor growth
(A) 107 wild-type or CCN2 shRNA-expressing Panc-1 cells were implanted subcutaneously in nu/nu mice and tumor volumes were monitored over time. Data are mean ± SEM with at least 7 mice per group; no significant difference by Student's t-test of AUCs. (B) Northern blots of wild-type or CCN2 shRNA-expressing Panc-1 cells used for tumor implants compared to cell lines generated from representative tumors excised 15-18 weeks after tumor implant. (C) 107 wild-type or CCN2 shRNA-expressing Su86.86 cells were implanted subcutaneously in nu/nu mice and tumor volumes were monitored over time. Data are mean ± SEM with at least 5 mice per group; *p<0.05 by Student's t-test of AUCs. Inset, Northern blot of total RNA from wild-type and CCN2 shRNA-expressing Su86.86 cells. (D) Upper, Northern blot of cell lines generated from representative subcutaneous CCN2 shRNA-expressing Su86.86 tumors harvested 8 weeks after tumor implant. Input cells represent the original CCN2 shRNA-expressing Su86.86 cells used for the tumor implants. Lower, Northern blot of total RNA extracted directly from excised subcutaneous wild-type or CCN2 shRNA-expressing Su86.86 tumors.
Figure 3
Figure 3. Clonal populations of CCN2 shRNA-expressing Panc-1 cells show decreased growth in soft agar
(A) Kinetics of CCN2 RNA and protein induction after changing media on the cells to fresh (10% FBS-containing) DMEM. (B) CCN2 expression in the indicated cell types was stimulated by changing the media. Clonal populations with high levels of CCN2 knockdown after serum-stimulation were selected for further study. (C) 5×10³ wild-type, CCN2 over-expressing, and CCN2 shRNA-expressing Panc-1 clones were plated in soft agar and allowed to grow for 2 weeks. Colonies were stained with Geimsa stain for visualization, and photographs were taken using a dissecting microscope (2×). (D) Quantification of soft agar colonies from (C). Data are mean ± SEM; *p<0.05 relative to control.
Figure 4
Figure 4. CCN2 knockdown decreases subcutaneous and orthotopic tumor growth, and increases the survival of orthotopic tumor-bearing mice
(A) 107 wild-type, CCN2 over-expressing, and CCN2 shRNA-expressing Panc-1 clones were subcutaneously implanted in nu/nu mice. Tumor volumes were monitored weekly using calipers. Panc-1 + CCN2 shRNA (pool) curve is included from Figure 2A for visual comparison purposes only. Data are mean ± SEM with at least 5 mice per group; *p<0.05 by ANOVA of AUCs. (B) 107 wild-type, CCN2 over-expressing, or CCN2 shRNA-expressing Panc-1 cells were orthotopically implanted in nu/nu mice. Tumor volume was monitored by uptake of intravenously administered 18F-deoxyglucose (FDG) using positron emission tomography (PET). Representative maximum intensity projections are shown, with regions of high FDG uptake highlighted. G = Harderian glands, H = heart, K = kidney, B = bladder, T = tumor. (C) Survival plot of mice bearing orthotopic pancreatic tumors. Data from 3-9 mice per group; p-values indicate comparison with mice bearing wild-type tumors by log-rank test.
Figure 5
Figure 5. CCN2 expression and secretion is increased by hypoxia and protects pancreatic tumor cells from hypoxia-induced apoptosis
(A) Pimonidazole (Hypoxyprobe-1) was administered 90 minutes prior to orthotopic Panc-1 tumor excision, and frozen tumor sections were analyzed for pimonidazole (red) and CCN2 (green). Areas of co-localization are indicated (yellow), and nuclei are stained with DAPI (blue). (B) Western blots of CCN2 and HIF-1α in Panc-1 cells incubated at 21% or 0.5% oxygen for the indicated periods of time before collection of cell lysate and conditioned media. Secreted CCN2 was obtained by contacting conditioned media with heparin sepharosecoated beads prior to loading. Actin in the cell lysate was used as a loading control. (C) Flow cytometric quantification of wild-type Panc-1 cells or Panc-1 shRNA-expressing clones exposed to 0.5% O2 for 24hr. Apoptotic cells were measured by annexin-V staining and quantified by flow cytometry. *p<0.05 relative to control cells.
Figure 6
Figure 6. CCN2 is associated with tumor tissue and hypoxia in clinical pancreatic adenocarcinoma samples
(A) Immunohistochemical staining for CCN2 and carbonic anhydrase-IX (CAIX) in paraffin-embedded samples from clinical pancreatic cancer patients. (B) CCN2 staining in pancreatic adenocarcinoma vs normal pancreatic tissue from the same patient (n=20). (C) CCN2 staining in pancreatic adenocarcinoma tissue vs stroma surrounding the tumor in the same section (n=30). (D) Overall CCN2 staining and CAIX staining in step-sections of clinical pancreatic adenocarcinoma samples (n=30).

References

    1. Jemal A, Siegel R, Ward E, et al. Cancer statistics, 2008. CA Cancer J Clin. 2008;58:71–96. - PubMed
    1. Korc M. Pancreatic cancer-associated stroma production. Am J Surg. 2007;194:S84–6. - PMC - PubMed
    1. Brigstock DR. The connective tissue growth factor/cysteine-rich 61/nephroblastoma overexpressed (CCN) family. Endocr Rev. 1999;20:189–206. - PubMed
    1. Leask A, Abraham DJ. All in the CCN family: essential matricellular signaling modulators emerge from the bunker. J Cell Sci. 2006;119:4803–10. - PubMed
    1. Perbal B. CCN proteins: multifunctional signalling regulators. Lancet. 2004;363:62–4. - PubMed

Publication types

MeSH terms