

Dissociation between symptoms and histological severity in pediatric eosinophilic esophagitis
- PMID: 19179876
- PMCID: PMC2699182
- DOI: 10.1097/MPG.0b013e31817f0197
Dissociation between symptoms and histological severity in pediatric eosinophilic esophagitis
Abstract
Objectives: The relation between patient symptoms and histological severity of eosinophilic esophagitis (EE) is not known. We created a pediatric EE symptom score (PEESS) and compared the results with histological findings in the esophagus.
Patients and methods: Subjects ages 3 to 18 years with a histological diagnosis of EE or their parent completed a survey rating the frequency and severity of their gastrointestinal symptoms. Scores ranged from 0 to 98. Eosinophil numbers in esophageal biopsy specimens were correlated with the PEESS.
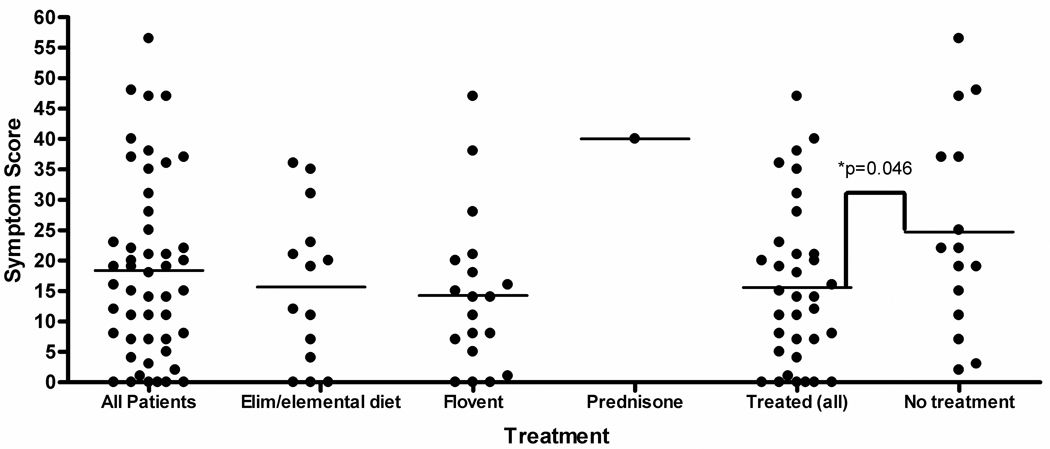
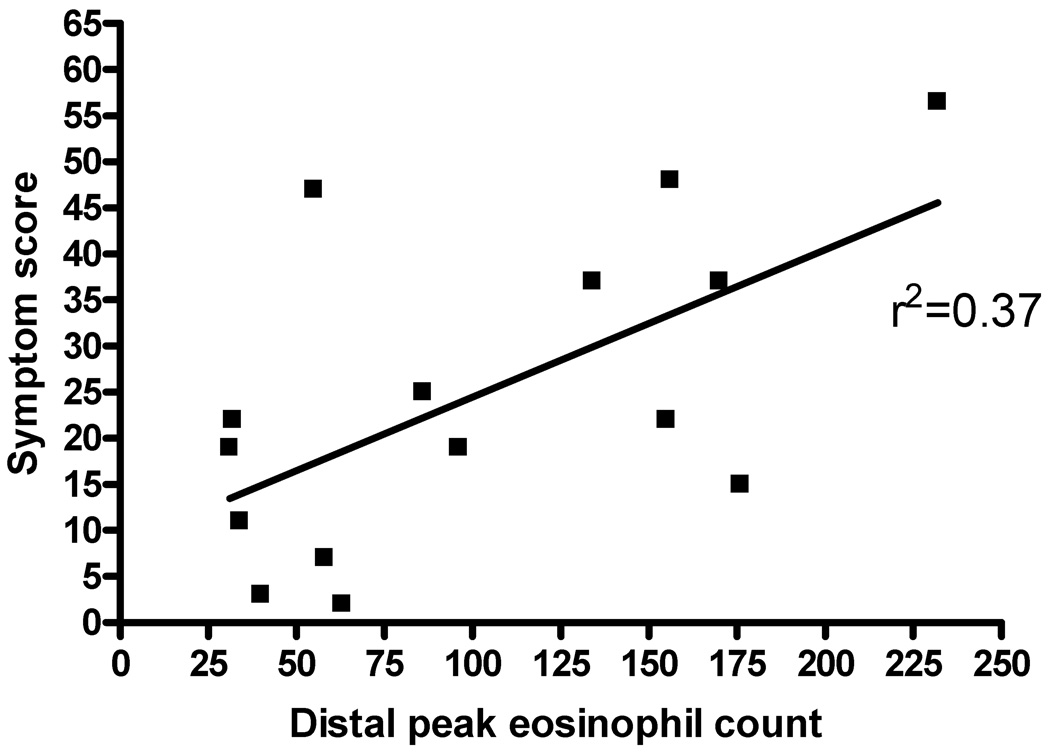
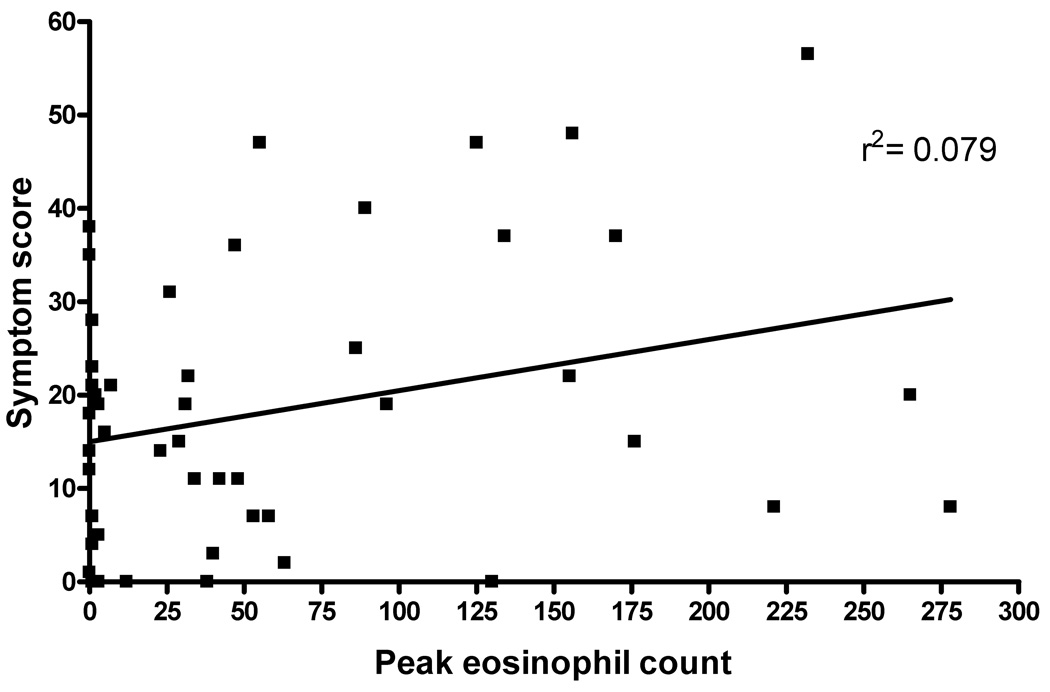
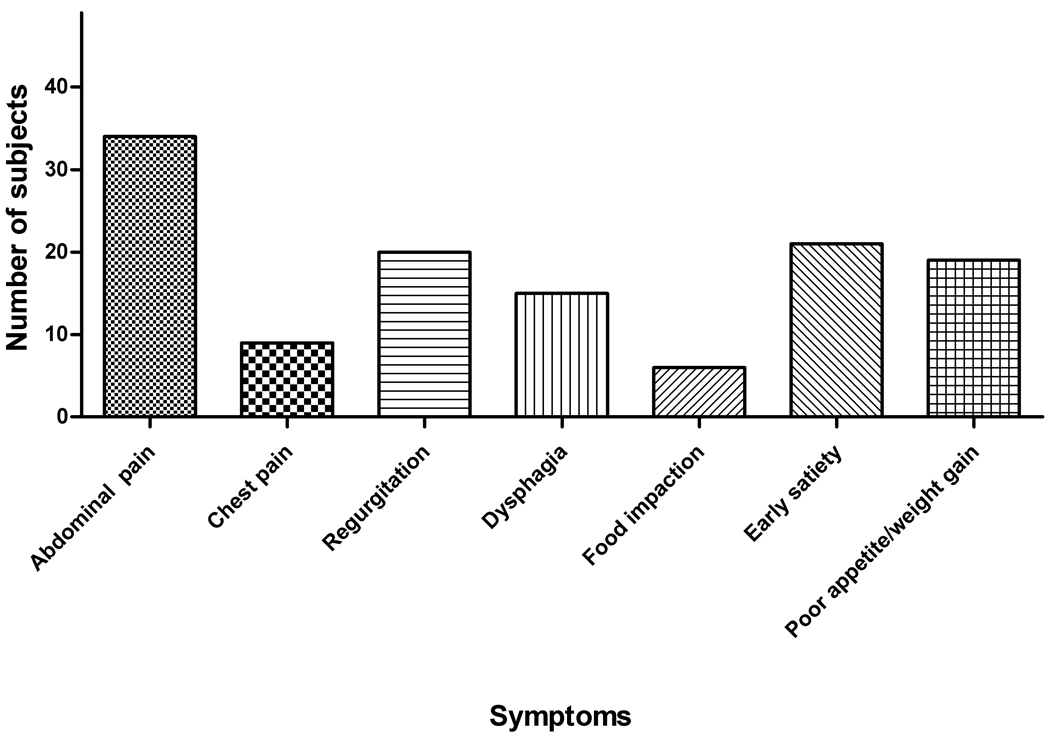
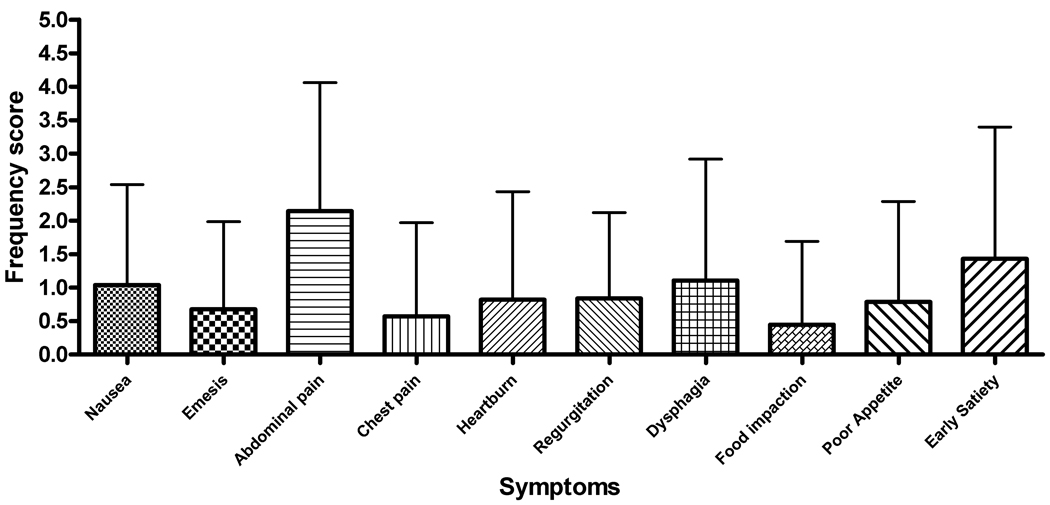
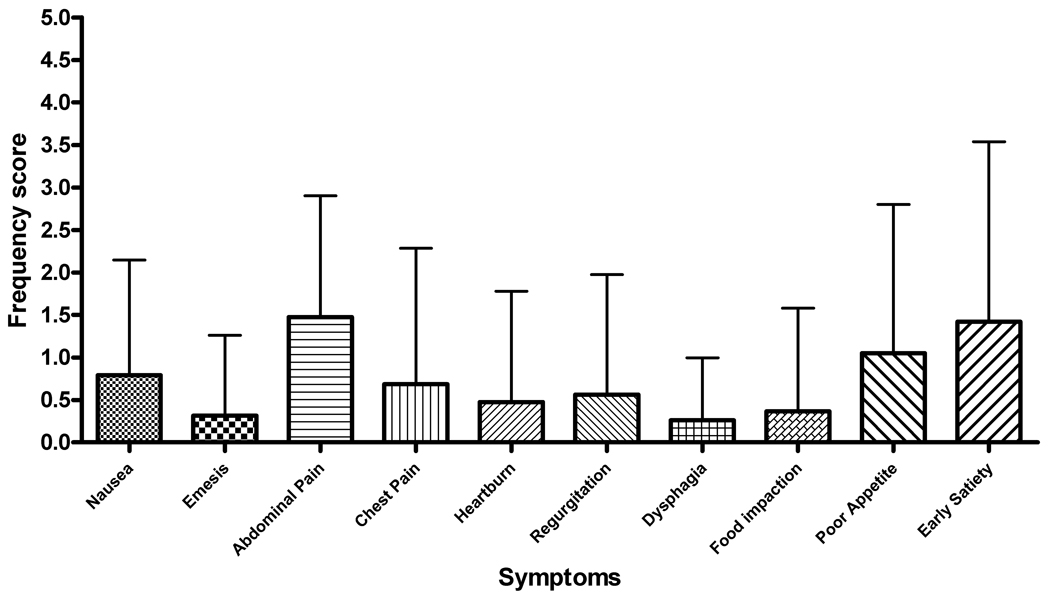
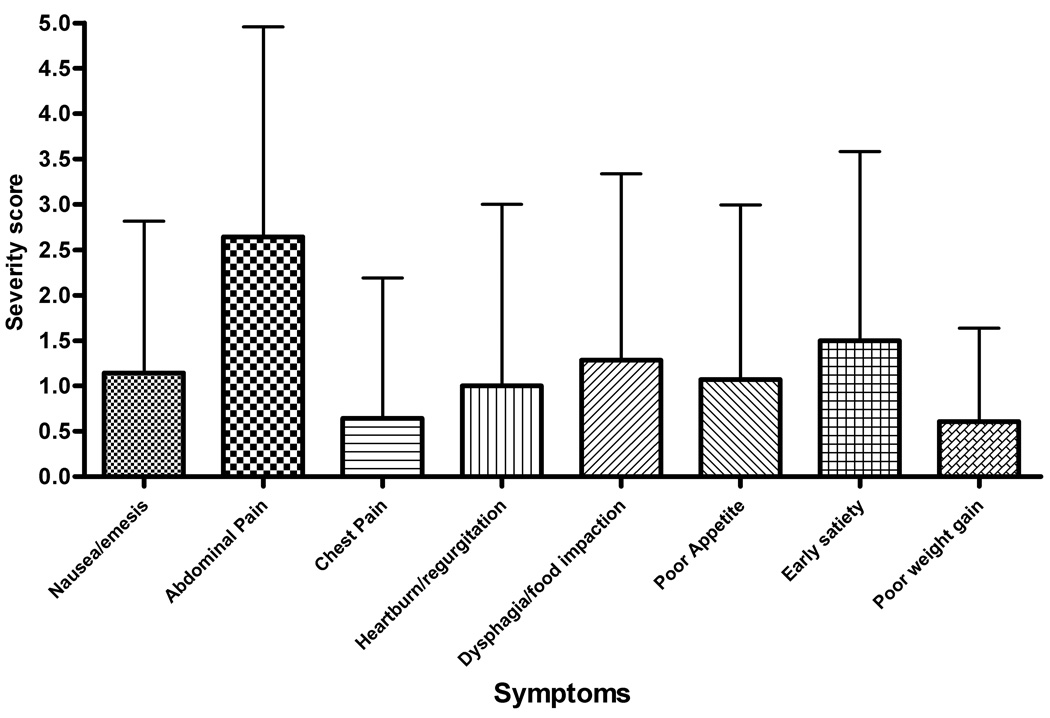
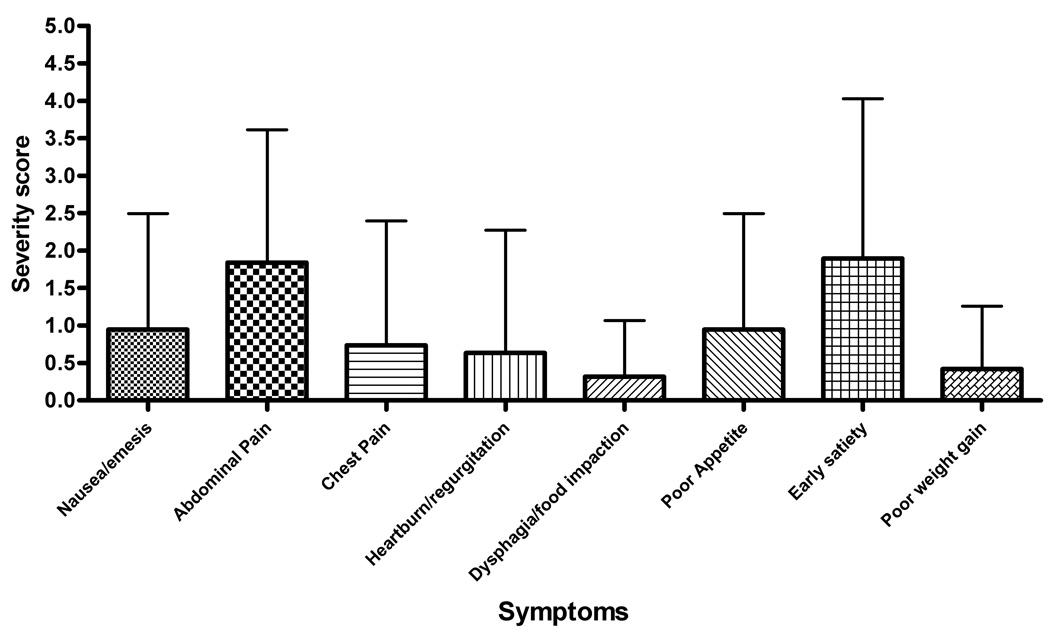
Results: A total of 49 subjects completed the PEESS. The symptom score did not correlate with the peak eosinophil count (r = 0.079). Newly diagnosed, untreated EE subjects (N = 15) had a mean score of 24.7 +/- 16.4 with a modest correlation between the PEESS and the number of eosinophils in the distal esophagus (r = 0.37). The mean PEESS score in the 34 treated patients was lower than in untreated patients (15.6 +/- 12.9; P = 0.046). The mean score for treated patients in histological remission was the same as for treated patients with active EE, regardless of treatment type. Abdominal pain was the most frequent and severe symptom reported. Among 20 of the 34 subjects (58.8%) in histological remission, 17 (85%) continued to report symptoms with a mean score of 17.4 +/- 9.9 (range 1-38). Three children with active histological EE (10%) reported no symptoms.
Conclusions: Children with untreated EE had a higher PEESS than treated subjects. Symptoms persisted in 85% of EE patients despite histological resolution and 10% with active EE reported no symptoms. Our data indicate a dissociation between symptoms and histology in pediatric EE.
Figures
References
-
- Fox VL, Nurko S, Furuta GT. Eosinophilic esophagitis: It's not just kid's stuff. Gastrointest Endosc. 2002;56:260–270. - PubMed
-
- Noel RJ, Putnam PE, Rothenberg ME. Eosinophilic esophagitis. N Engl J Med. 2004;351:940–941. - PubMed
-
- Straumann A, Simon H. Eosinophilic esophagitis: escalating epidemiology? J Allergy Clin Immunol. 2005;115:418–419. - PubMed
-
- Orenstein SR, Shalaby T, Di Lorenzo C, et al. The spectrum of pediatric eosinophilic esophagitis beyond infancy: A clinical series of 30 children. Am J Gastroenterol. 2000;95:1422–1430. - PubMed
-
- Liacouras CA, Spergel J, Ruchelli E, et al. World Congress of Pediatric Gastroenterology. Paris, France: Hepatology, and Nutrition; 2004. Eosinophilic esophagitis: An 8 year experience.
Publication types
MeSH terms
Grants and funding
LinkOut - more resources
Full Text Sources
Other Literature Sources
Medical
