

Coordinated concentration changes of transcripts and metabolites in Saccharomyces cerevisiae
- PMID: 19180179
- PMCID: PMC2614473
- DOI: 10.1371/journal.pcbi.1000270
Coordinated concentration changes of transcripts and metabolites in Saccharomyces cerevisiae
Abstract
Metabolite concentrations can regulate gene expression, which can in turn regulate metabolic activity. The extent to which functionally related transcripts and metabolites show similar patterns of concentration changes, however, remains unestablished. We measure and analyze the metabolomic and transcriptional responses of Saccharomyces cerevisiae to carbon and nitrogen starvation. Our analysis demonstrates that transcripts and metabolites show coordinated response dynamics. Furthermore, metabolites and gene products whose concentration profiles are alike tend to participate in related biological processes. To identify specific, functionally related genes and metabolites, we develop an approach based on Bayesian integration of the joint metabolomic and transcriptomic data. This algorithm finds interactions by evaluating transcript-metabolite correlations in light of the experimental context in which they occur and the class of metabolite involved. It effectively predicts known enzymatic and regulatory relationships, including a gene-metabolite interaction central to the glycolytic-gluconeogenetic switch. This work provides quantitative evidence that functionally related metabolites and transcripts show coherent patterns of behavior on the genome scale and lays the groundwork for building gene-metabolite interaction networks directly from systems-level data.
Conflict of interest statement
The authors have declared that no competing interests exist.
Figures
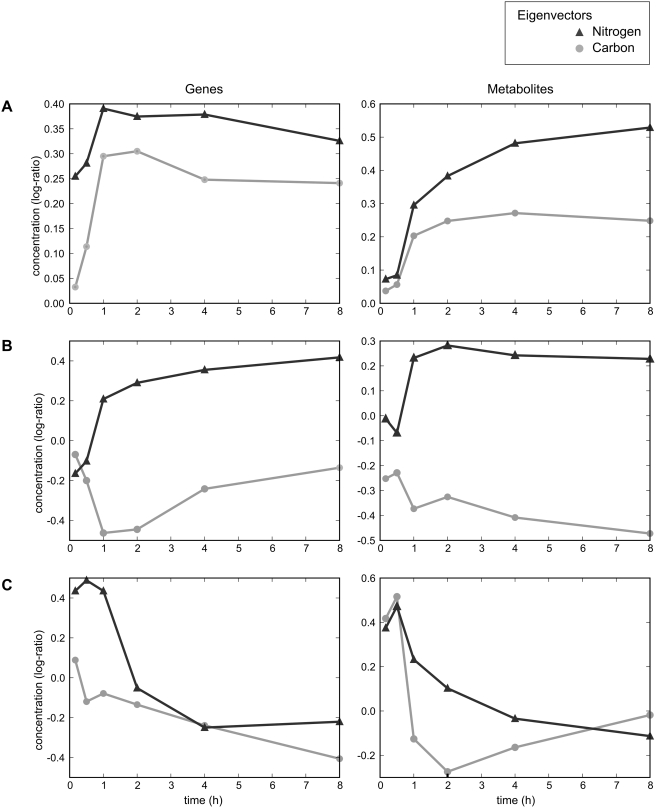

 ratios of measurements from starved cells to measurements from unstarved cells. The responses observed under carbon starvation (light gray circles, “Carbon” in legend) are labeled distinctly from the responses under nitrogen starvation (dark gray triangles, “Nitrogen” in legend), but are plotted on the same axes. Solid light gray and dark gray lines are linear best-fits for the responses observed under carbon and nitrogen starvation, respectively; the dashed line is a linear best-fit curve for all data. (A–E) Scatterplots of metabolites from the glycolysis and pentose-phosphate pathway metabolic class versus related genes show an inverse relationship under carbon starvation, but a positive correlation under nitrogen starvation. The dashed line shows that this relationship would be obscured by computing correlation across all data points. ILV2 catalyzes the first step of isoleucine and valine biosynthesis from pyruvate; ARO3 catalyzes the first step in aromatic amino acid biosynthesis from PEP and erythrose-4-phosphate; ALD6, which also plays a key role in redox metabolism, is involved in the creation of cytosolic acetyl-CoA from pyruvate; GLK1 phosphorylates glucose to glucose-6-phosphate; and PGM2 catalyzes the interconversion of glucose-1-phosphate and glucose-6-phosphate. (F–H) Scatterplots of metabolites from the amino acid metabolic class versus related genes, in contrast, show positive correlation in both carbon and nitrogen starvation. Even in this case, however, computing correlation across both conditions can lead to an underestimation of the extent of the relationship (e.g., (H) threonine vs. THR4, where although
  and
and  ,
,  ). HTS1 charges (i.e. aminoacylates) the histidinyl-tRNA; MET6 catalyzes the formation of methionine from homocysteine; and THR4 converts phosphohomoserine to threonine.

References
-
- Sauer U, Heinemann M, Zamboni N. Genetics. Getting closer to the whole picture. Science. 2007;316:550–551. - PubMed
-
- Askenazi M, Driggers EM, Holtzman DA, Norman TC, Iverson S, et al. Integrating transcriptional and metabolite profiles to direct the engineering of lovastatin-producing fungal strains. Nat Biotechnol. 2003;21:150–156. - PubMed
-
- Suzuki H, Reddy MSS, Naoumkina M, Aziz N, May GD, et al. Methyl jasmonate and yeast elicitor induce differential transcriptional and metabolic re-programming in cell suspension cultures of the model legume Medicago truncatula. Planta. 2005;220:696–707. - PubMed
Publication types
MeSH terms
Substances
Grants and funding
LinkOut - more resources
Full Text Sources
Molecular Biology Databases
