. 2009 Jan;5(1):e1000281.
doi: 10.1371/journal.ppat.1000281. Epub 2009 Jan 30.

Estimation of transmission parameters of H5N1 avian influenza virus in chickens

Affiliations

Estimation of transmission parameters of H5N1 avian influenza virus in chickens

Annemarie Bouma et al. PLoS Pathog. 2009 Jan.

Abstract

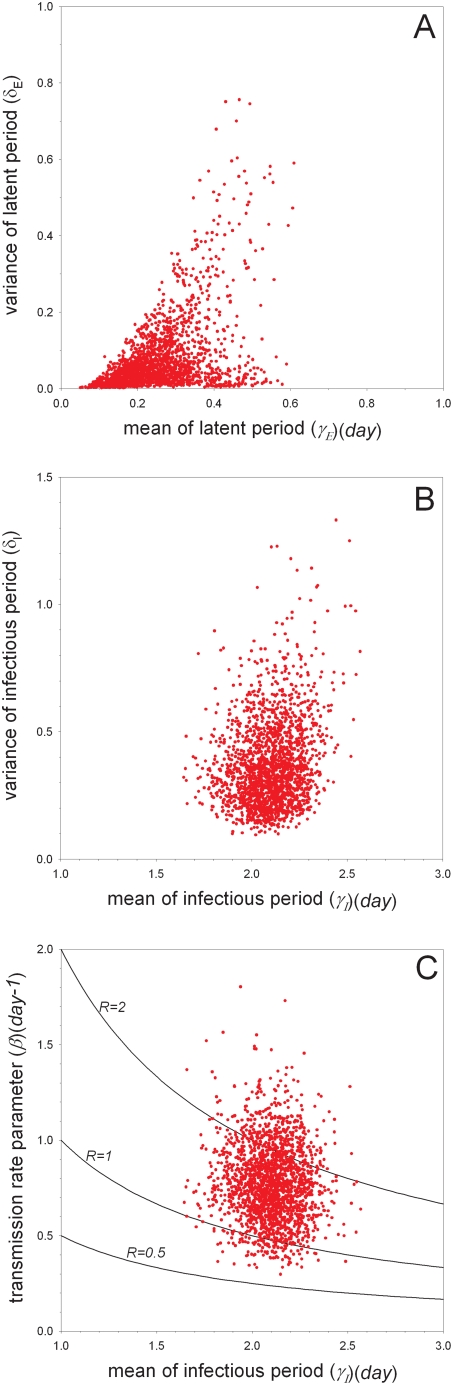
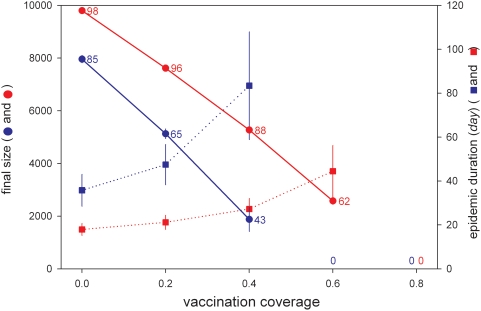
Despite considerable research efforts, little is yet known about key epidemiological parameters of H5N1 highly pathogenic influenza viruses in their avian hosts. Here we show how these parameters can be estimated using a limited number of birds in experimental transmission studies. Our quantitative estimates, based on Bayesian methods of inference, reveal that (i) the period of latency of H5N1 influenza virus in unvaccinated chickens is short (mean: 0.24 days; 95% credible interval: 0.099-0.48 days); (ii) the infectious period of H5N1 virus in unvaccinated chickens is approximately 2 days (mean: 2.1 days; 95%CI: 1.8-2.3 days); (iii) the reproduction number of H5N1 virus in unvaccinated chickens need not be high (mean: 1.6; 95%CI: 0.90-2.5), although the virus is expected to spread rapidly because it has a short generation interval in unvaccinated chickens (mean: 1.3 days; 95%CI: 1.0-1.5 days); and (iv) vaccination with genetically and antigenically distant H5N2 vaccines can effectively halt transmission. Simulations based on the estimated parameters indicate that herd immunity may be obtained if at least 80% of chickens in a flock are vaccinated. We discuss the implications for the control of H5N1 avian influenza virus in areas where it is endemic.


Conflict of interest statement

The authors have declared that no competing interests exist.

Figures

Figure 1
Figure 1. Bayesian analysis of the experiments with unvaccinated birds (scenario B).
Shown are samples from the marginal posterior density of the mean versus variance of the latent period (A), the mean versus variance of the infectious period (B), and the mean infectious period versus transmission rate parameter (C). The contours in (C) correspond to specific values of the reproduction number. See Figures S1, S2, and S3 for additional results.
Figure 2
Figure 2. Bayesian analysis of the experiments with unvaccinated birds (scenario C).
Shown are samples from the marginal posterior density of the mean versus variance of the latent period (A), the mean versus variance of the infectious period (B), and the mean infectious period versus transmission rate parameter (C). Blue and red dots refer to parameters characterizing the low- and high-dose experiments, respectively. The contours in (C) correspond to specific values of the reproduction number. See Figure S4 for additional results.
Figure 3
Figure 3. Bayesian analysis of the experiments with unvaccinated birds (scenario D).
Shown are samples from the marginal posterior density of the mean versus variance of the latent period (A), the mean versus variance of the infectious period (B), and the mean infectious period versus transmission rate parameter (C). Dots refer to parameters characterizing the contact infections. The contours in (C) correspond to specific values of the reproduction number. See Figure S5 for additional results.
Figure 4
Figure 4. Simulations of an epidemic in a population of 50,000 birds.
Parameters values are based on the estimates of Table 4 (scenario A1). A dot is plotted for the population state after each tenth event. (A) transmission parameter as in Table 4 (0.8 (day−1)) and (B) transmission parameter increased twofold (1.6 (day−1)).
Figure 5
Figure 5. The effect of preventive vaccination as a function of vaccination coverage.
Circles refer to the final size of major outbreaks (error bars: ±2SD) and squares indicate the duration of major outbreaks (error bars: ±2SD). Blue and red lines represent the low and high transmissibility scenarios, respectively (cf. Figure 4). 100 simulations are performed for each parameter constellation. Numbers near the circles refer to the number of simulations that yield a major outbreak. Major outbreaks are operationally defined as those outbreaks in which at least 50 birds are infected.

References

    1. de Jong JC, Claas EC, Osterhaus AD, Webster RG, Lim WL. A pandemic warning? Nature. 1997;389:554. - PMC - PubMed
    1. Webby RJ, Webster RG. Are we ready for pandemic influenza? Science. 2003;28:1519–1522. - PubMed
    1. Alexander DJ. Summary of avian influenza activity in Europe, Asia, Africa, and Australasia, 2002–2006. Avian Diseases. 2007;51:161–166. - PubMed
    1. Ducatez MF, Olinger CM, Owoade AA, De Landtsheer S, Ammerlaan W, et al. Avian flu: multiple introductions of H5N1 in Nigeria. Nature. 2006;442:37. - PubMed
    1. Truscott J, Garske T, Chis-Ster I, Guitian J, Pfeiffer D, et al. Control of a highly pathogenic H5N1 avian influenza outbreak in the GB poultry flock. Proceedings of the Royal Society B. 2007;274:2287–2295. - PMC - PubMed

Publication types

Substances