. 2009 Jan;5(1):e1000358.
doi: 10.1371/journal.pgen.1000358. Epub 2009 Jan 30.

Learning a prior on regulatory potential from eQTL data

Affiliations

Learning a prior on regulatory potential from eQTL data

Su-In Lee et al. PLoS Genet. 2009 Jan.

Abstract

Genome-wide RNA expression data provide a detailed view of an organism's biological state; hence, a dataset measuring expression variation between genetically diverse individuals (eQTL data) may provide important insights into the genetics of complex traits. However, with data from a relatively small number of individuals, it is difficult to distinguish true causal polymorphisms from the large number of possibilities. The problem is particularly challenging in populations with significant linkage disequilibrium, where traits are often linked to large chromosomal regions containing many genes. Here, we present a novel method, Lirnet, that automatically learns a regulatory potential for each sequence polymorphism, estimating how likely it is to have a significant effect on gene expression. This regulatory potential is defined in terms of "regulatory features"-including the function of the gene and the conservation, type, and position of genetic polymorphisms-that are available for any organism. The extent to which the different features influence the regulatory potential is learned automatically, making Lirnet readily applicable to different datasets, organisms, and feature sets. We apply Lirnet both to the human HapMap eQTL dataset and to a yeast eQTL dataset and provide statistical and biological results demonstrating that Lirnet produces significantly better regulatory programs than other recent approaches. We demonstrate in the yeast data that Lirnet can correctly suggest a specific causal sequence variation within a large, linked chromosomal region. In one example, Lirnet uncovered a novel, experimentally validated connection between Puf3-a sequence-specific RNA binding protein-and P-bodies-cytoplasmic structures that regulate translation and RNA stability-as well as the particular causative polymorphism, a SNP in Mkt1, that induces the variation in the pathway.


Conflict of interest statement

The authors have declared that no competing interests exist.

Figures
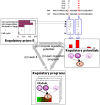
Figure 1
Figure 1. Outline of our approach.
Our algorithm, called Lirnet, aims to learn the regulatory potential of an individual SNP, simultaneously with the regulatory network from an eQTL data set. The regulatory potential of a regulator is defined as a function of its regulatory features, such as the conservation of a SNP or the function of a gene (Figure 2, Tables S1, S2, S3). The weight of each regulatory feature is called the regulatory prior. All three components – the regulatory programs, the regulatory potentials, and the regulatory priors – are learned from data, in an unbiased way, by iterating the following three steps: (i) Lirnet takes as input the regulatory potentials for each regulator, and constructs a set of regulatory programs for the genes in the data, using the regulatory potentials to bias the choice of active regulators used. In the first iteration, the regulatory potentials are taken to be uniform. (ii) Lirnet takes as input the regulatory programs, and learns which types of regulators are more predictive of their putative targets (which ones occur more often in the learned regulatory programs), and adjusts the regulatory prior to match the observed trends. (iii) Lirnet takes as input the regulatory priors, and computes the regulatory potential of each SNP by computing the total contribution of its regulatory features, weighted by the learned regulatory priors. The regulatory potential of each chromosomal region (genotype regulator) is then computed by aggregating the contributions of the individual SNPs in the region.
Figure 2
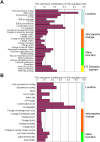
Figure 2. Learned regulatory priors in yeast and human.
Shown are the maximum effect of the different regulatory features, given the learned regulatory priors for the different regulatory features, in (A) yeast and (B) human (CEU) data sets. Each bar lists the maximum contribution that a given regulatory feature can make to the regulatory potential: the feature's regulatory prior, multiplied by the difference between its maximal and minimal value. For clarity, only the regulatory features whose regulatory priors are greater than 0.05 are shown in this graph. The full list of regulatory priors, including that for human YRI dataset, can be found in Tables S2, S3. (*) As described in Methods, the pairwise features are constructed based on -log(p-value), indicating the enrichment of the corresponding regulator's putative targets in the module. Since these values have much higher variation than others, for a more clear and intuitive presentation, we report the amount of contribution made by an increase of the −log10(p-value) by 3.
Figure 3
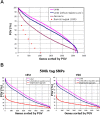
Figure 3. Statistical evaluation of learned regulatory programs.
Proportion of genetic variation in gene expression explained by different methods. The percentage of genetic variation (PGV) explained by detected regulation programs for Lirnet with learned regulatory potential (pink), Lirnet with uniform regulatory potential (blue). (A) The PGV curves for the yeast data with additional comparison to Geronemo (brown) and the eQTL analysis of Brem & Kruglyak (red points) applied to the same dataset. The graph shows the PGVg values (y-axis) of 3152 genes (x-axis). The genes (x-axis) are sorted by their PGVg, shown on the y-axis. A more refined PGV analysis, with an independent test set is shown in Figure S1A. (B) The PGV results for the human HapMap data with 500 k tag SNPs (Affymetrix), for both the CEU and YRI individuals. Similarly, we compare Lirnet (pink) to the variant with a uniform regulatory potential (blue) and to a classical single-marker approach (red; see Methods). Results for 100 k tag SNPs are shown in Figure S1D, and the results with an independent test set is shown in Figure S1B & C for 500 k and 100 k tag SNPs, respectively.
Figure 4
Figure 4. Evaluation of the learned network in comparison to results of Zhu et al. .
We compared two versions of Lirnet results with the learned network of Zhu et al: all 10,565 regulator-target pairs from the regulatory network (‘full’ in the graph legend); 3,645 top-ranked pairs, in terms of the magnitude of the weight, to provide a comparable number of predictions to the network of Zhu et al (‘reduced’ in the graph legend). We evaluated support for these sets of edges in the gene expression data of ,. Here, a pair r-t for a regulator r and target t is considered supported if t is in the top X% of differentially expressed genes in response to a knockout or over-expression of R. (A) Shows the cumulative distribution of the number of computational predictions that receive support for different values of X (top). As a baseline, we also show the number of validated predictions expected in a random regulatory network. Not all regulators were tested in the microarray data. To avoid possible biases, we also compare the fraction of validated predictions among all predictions that were tested (bottom). We see that Lirnet selects many more tested predictions than the method of Zhu et al., but also has a much higher fraction of validated predictions, even when we focus only on tested predictions. (B) Candidate causal regulators for 13 chromosomal regions identified in a previous study. For the 13 hot spots previously suggested , we applied our approach to compute the regulatory potential to prioritize the candidate genes in each region. The first four columns are from the paper by Zhu et al . For each hot spot, we present the causal regulators suggested by: the original paper of ; the method of Zhu et al, and the top 3 Lirnet regulators, ranked by their regulatory potentials (see Methods). The causal regulators that have some support (see Methods) are colored accordingly (see legend). Of the top Lirnet regulators, 14 regulators, spanning 11 hot spots, have experimental support, in comparison to 8 regulators (7 hot spots) in the analysis of Zhu et al. Even if we consider only Lirnet's top regulator for each region, there is experimental support for 10 regulators (in 10 hot spots). The results of the previous method (first four columns) are from Table 3 of Zhu et al , except for the indication of the supported regulators.
Figure 5
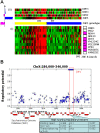
Figure 5. The Zap1 module.
(A) (i) The mRNA expression profiles (log2 ratios) of the module's 10 target genes, where the rows are genes and the columns are strains. (ii) The module is regulated by five predicted regulators, where the two that have the most significant coefficients are the expression pattern of ZAP1 and a genetic region on chromosome 10 containing ZAP1. The bar on the left of each regulator represents its coefficient in the regulatory program: the length encodes its absolute value, purple represents a negative weight and blue a positive one. (iii) Six of the target genes (ADH4, ZTR3, YNL254C, YGL258W, ZPS1/YOL154W, and YOR387C) were identified as probable Zap1 targets based on the presence of a consensus ZRE element and RNA expression patterns . (B) The genetic region on chromosome 10, with the inferred regulatory potentials for each of the SNPs it contains (Table S7). Also shown are the regulatory features that contributed the most to the selection of a SNP in Zap1 as the causal polymorphism: a known binding relationship between Zap1 and two of the target genes, the presence of non-synonymous coding changes and their effect on various protein properties, and the gene's annotation as having transcriptional regulator activity. All the other minor regulators of this module (Dhh1, Gcr1 and Gis2) are not located in this region; they are in chr 4, 16 and 14, respectively.
Figure 6
Figure 6. The peroxisome module.
(A) The module contains 10 target genes (i), regulated by 2 predicted regulators (ii) – a genetic region on chromosome 1 containing OAF1, and the expression pattern of PIP2, the other component in the Oaf1-Pip2 heterodimer. (iii) Six of the target genes (POX1, FAA2, TPO4, ANT1, YPLO95C and CLN3) contain a canonical Oaf1 binding site (ORE) . The two predicted regulators and five of the target genes are among the most significantly down regulated RNA transcripts in an oaf1Δ microarray with the following ranks: POX1 (1st), YPL095 (2nd), FAA2 (5th), YHR140W (14th), TPO4 (23rd), OAF1 (9th), PIP2 (29th). (B) The genetic region on chromosome 1, with the inferred regulatory potentials for each of the SNPs it contains (Table S8). Also shown are the regulatory features that contributed to the selection of a SNP in Oaf1 as the causal polymorphism.
Figure 7
Figure 7. The Puf3 module.
(A) A module of 153 target genes (i), which is strongly enriched for targets of the mRNA-binding protein Puf3 (shown on right, p<10−130; Figure S3), but neither the expression profile nor the genotype of Puf3 (shown on bottom: BY = blue, RM = yellow) are correlated with the module expression profile. (ii) The Lirnet regulatory program: the most significant predicted regulator is P-body component DHH1, but the regulatory program also contains P-body component Kem1, as well as translational regulators Gcn1/Gcn20. (B) Localization of Puf3 to P-bodies. Images of live cells containing a Puf3-GFP fusion and the P-body components Dhh1 or Edc3 fused to the red fluorescent protein tdimer2 (td2) (A) Puf3-GFP; (C) Dhh1-td2; (E) merged image; (B) Puf3-GFP; (D) Edc3-td2; (F) merged image. Strains containing only the Puf3-GFP fusion protein, i.e. no labeled P-body protein, formed similar fluorescent spots under the same environmental conditions (Figure S5). When present in the same cells, punctate spots of Puf3-GFP fluorescence significantly overlap with the punctate pattern formed by known P-body components (Table S10).
Figure 8
Figure 8. The post-transcriptional regulation (PTR) module.
(A) A module of 40 target genes and its regulatory program, consisting of a genotype marker on Chromosome XIV. The module is strongly enriched for genes involved in post-transcriptional regulation processes (Figure S6), and contains many of the regulators of the Puf3 module, including P-body components Dhh1 and Kem1, and both components of the Gcn1/Gcn20 complex that regulates translation under conditions of nutrient starvation. The module's only predicted regulator is at 449,639 on Chromosome XIV. (i) The mRNA expression profiles (log2 ratios) of the 40 module target genes, where the rows are genes and the columns are arrays (segregants), sorted by the genotype of the segregants in the linked region on Chr XIV (shown in (ii)). (iii) Annotation of the 16 module members that are in the top 5% of genes up-regulated in the mkt1Δ array in an RM background (hypergeometric p<10−10). (iv) Expression profile of MKT1 in the original arrays; MKT1 was not included in our original analysis, as it did not meet our stringent cutoff for variation in expression values. (B) Of the 30 genes in the chromosome XIV region selected as the module's regulator, the highest regulatory potential is obtained by MKT1 (Table S9). Also shown are the regulatory features that contributed the most to the selection of a SNP in Mkt1 as the causal polymorphism: conservation, linkage to the adjacent chromosomal marker (cis-regulation), common GO process annotation with target genes, the presence of non-synonymous coding mutations and their effect on properties of the resulting protein, and to a lesser extent being annotated as regulating translation. (C) RNA expression levels of an mkt1Δ in an RM background. Expression-value distribution for the Puf3 Module target genes (green), the PTR Module target genes (red), and the remaining genes (dark blue). The results show a modest (average fold change 0.9) but consistent down-regulation of the Puf3 Module (KS p-value<10−23) and up-regulation of the PTR Module (KS p-value<10−6).

References

    1. Yvert G, Brem RB, Whittle J, Akey JM, Foss E, et al. Trans-acting regulatory variation in Saccharomyces cerevisiae and the role of transcription factors. Nat Genet. 2003;35:57–64. - PubMed
    1. Schadt EE, Monks SA, Drake TA, Lusis AJ, Che N, et al. Genetics of gene expression surveyed in maize, mouse and man. Nature. 2003;422:297–302. - PubMed
    1. Brem RB, Kruglyak L. The landscape of genetic complexity across 5,700 gene expression traits in yeast. Proc Natl Acad Sci U S A. 2005;102:1572–1577. - PMC - PubMed
    1. Stranger BE, Nica AC, Forrest MS, Dimas A, Bird CP, et al. Population genomics of human gene expression. Nat Genet. 2007;39:1217–1224. - PMC - PubMed
    1. Chen Y, Zhu J, Lum PY, Yang X, Pinto S, et al. Variations in DNA elucidate molecular networks that cause disease. Nature. 2008;452:429–435. - PMC - PubMed

Publication types