. 2009;4(1):e4331.
doi: 10.1371/journal.pone.0004331. Epub 2009 Jan 30.

Metabolic consequences and vulnerability to diet-induced obesity in male mice under chronic social stress

Affiliations

Metabolic consequences and vulnerability to diet-induced obesity in male mice under chronic social stress

Alessandro Bartolomucci et al. PLoS One. 2009.

Abstract

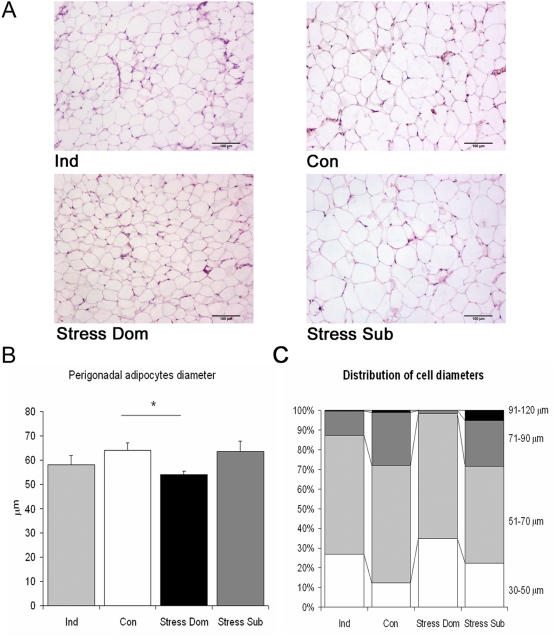
Social and psychological factors interact with genetic predisposition and dietary habit in determining obesity. However, relatively few pre-clinical studies address the role of psychosocial factors in metabolic disorders. Previous studies from our laboratory demonstrated in male mice: 1) opposite status-dependent effect on body weight gain under chronic psychosocial stress; 2) a reduction in body weight in individually housed (Ind) male mice. In the present study these observations were extended to provide a comprehensive characterization of the metabolic consequences of chronic psychosocial stress and individual housing in adult CD-1 male mice. Results confirmed that in mice fed standard diet, dominant (Dom) and Ind had a negative energy balance while subordinate (Sub) had a positive energy balance. Locomotor activity was depressed in Sub and enhanced in Dom. Hyperphagia emerged for Dom and Sub and hypophagia for Ind. Dom also showed a consistent decrease of visceral fat pads weight as well as increased norepinephrine concentration and smaller adipocytes diameter in the perigonadal fat pad. On the contrary, under high fat diet Sub and, surprisingly, Ind showed higher while Dom showed lower vulnerability to obesity associated with hyperphagia. In conclusion, we demonstrated that social status under chronic stress and individual housing deeply affect mice metabolic functions in different, sometime opposite, directions. Food intake, the hedonic response to palatable food as well as the locomotor activity and the sympathetic activation within the adipose fat pads all represent causal factors explaining the different metabolic alterations observed. Overall this study demonstrates that pre-clinical animal models offer a suitable tool for the investigation of the metabolic consequences of chronic stress exposure and associated psychopathologies.


Conflict of interest statement

Competing Interests: GD supported the development of the automated system for activity measurement in collaboration with Technosmart.

Figures

Figure 1
Figure 1. Behavioral consequences of chronic psychosocial social stress in mice.
A) Aggressive behavior assessed on days 1 to 4, 10 and 20 of the stress phase. Graph clearly shows how dominants (Dom) and subordinates (Sub) are non-overlapping behavioral categories. B) Locomotor activity measured during baseline (4 days) and the stress phase (20 days). Dom showed increased and Sub showed decreased locomotor activity (F(1,18) = 21.9, p<0.01). C) Locomotor activity measured before and after the daily agonistic interaction. Dom showed increased activity both before and after the agonistic interaction while Sub showed increased activity before but not after the agonistic interaction (F(1,18) = 4.1, p = 0.054). * p<0.05 and ** p<0.001 vs. basal, # p<0.05 vs. Dom.
Figure 2
Figure 2. Hormonal consequences of social stress in mice.
Basal plasma corticosterone collected in the early light phase, was increased in subordinates (Sub, U9,13 = 23, p<0.016), dominants (Dom, U9,12 = 12, p<0.016) and individually housed (Ind, U9,5 = 3, p<0.005) mice when compared to Controls (Con). * p<0.016.
Figure 3
Figure 3. Metabolic consequences of social stress in mice.
A) Body weight changes in the baseline and in the stress phase. At baseline, all experimental groups showed a trend for a lower body weight gain than controls (Con) (F(3,39) = 2.6, p = 0.06). In the stress phase, subordinates (Sub) showed a larger body weight gain when compared to all other groups, which were not different from each other (F(3,38) = 4.6, p<0.01). Figure describes only post hoc comparisons to controls, * p<0.05; § p = 0.06. B) Body weight changes from baseline in Con and individually housed (Ind) mice starting from the first day of baseline. Ind showed a lower growth curve when compared to Con over the whole testing phase (F(1,15) = 6.3, p<0.05. * p<0.05. C) Food intake. Sub and dominants (Dom) mice under stress where hyperphagic when compared to baseline, Con and Ind mice (treatment, F(3,33) = 7.4, p<0.001; treatment x weeks F(9,99) = 3.8, p<0.001). In addition, Ind mice showed an overall lower level of kcal ingested when compared to controls. D) Visceral fat pads weight. Dom showed a smaller perigonadal (F(3,37 = 3.2, p<0.05), perirenal (F(3,37 = 3.2, p<0.05) and a trend for lower retroperitoneal (F(3,37 = 1.7, p = 0.1) pad weight than Con. * p<0.05, §p<0.07 vs. Con. E) Cumulative weight of visceral fat mass. Dom showed a reduction of visceral fat when compared to Con (F(3,37) = 2.3, p<0.1). * p<0.05 vs. Con.
Figure 4
Figure 4. Effect of chronic stress on the histology of the perigonadal adipose tissue.
A) Representative sections of perigonadal adipose tissue from individually housed (Ind), Control (Con), subordinate (Sub) and dominant (Dom) mice. B) Dom mice showed a significant smaller mean adipocytes diameter when compared to Con (U10,10 = 17, p<0.016), while all other groups remained unaffected. C) Categorized distribution of individual adipocytes diameters (see text for statistical details).
Figure 5
Figure 5. Sympathetic system related parameters in mice adipose tissue.
A) Perigonadal adipose tissue tyrosine hydroxylase (TH) enzymatic activity assay revealed a small but not significant increase in the dominant (Dom) mice. B) Dom mice showed a higher perigonadal norepinephrine (NE) concentration than Controls (Con) (F(3,21) = 6.0, p<0.01). *p<0.05.
Figure 6
Figure 6. Vulnerability to high fat diet-induced obesity.
A) Body weight changes in the baseline and in stress phase. At baseline, when mice were fed standard diet, all experimental groups showed a decrease in body weight, while controls (Con) showed a slight increase (F(3,23) = 3.2, p<0.05). In the stress phase subordinates (Sub) and individually housed (Ind) mice were more, and dominant (Dom) were less, vulnerable to weight gain than Con (F(3,23) = 5.3, p<0.01). In the graph only statistical comparison with Con are shown. In addition, both Sub and Ind mice differed from Dom (p<0.001) and Sub differed from Ind on day 14 only (p<0.05). B) Food intake. When animals were fed a high fat diet they showed a marked increase in kcal ingested. However a clear difference emerged between experimental groups (F(6,32) = 2.9, p<0.05) with Dom and Ind showing sustained hyperphagia when compared to Con along the entire experiment. Sub were hyperphagic only in the third week while showing a trend in the second week of the stress phase. Finally Sub also differed from Ind and Dom in the first week of the stress phase (p<0.01). C) Food efficiency analysis revealed that while Con were able to maintain a balance trough the changing dietary environment, Sub and Ind but not Dom significantly increased food efficiency with HFD (F(9,69) = 5.1, p<0.0001). D) Visceral fat pad weight. Dom showed an overall lower amount of perigonadal (F(3,23) = 9.2, p<0.001), perirenal (F(3,23) = 2.5, p<0.08), retroperitoneal (F(3,23) = 3.7, p<0.05) and mesenteric (F(3,23) = 7.2, p<0.005) but not mediastinic fat pad weight when compared to Sub. Ind showed a robust increase in perigonadal, retroperitoneal and mesenteric adipose fat pads which was significant versus Con and Dom but not versus Sub. E) Cumulative weight of visceral fat mass. Dom showed lower overall visceral adipose tissue than Sub. On the contrary Ind differed from Con and Dom but not from Sub (F(3,23) = 8.4, p<0.001). * p<0.05 and **p<0.01 vs. Controls, § p<0.07 vs. Controls, ç p<0.01 vs. Con and Dom. #p<0.05 and ## p<0.01 vs. Basal level for each group. Arrows describe the change from standard to high fat diet.
Figure 7
Figure 7. Overview of the metabolic effects induced by chronic psychosocial stress and individual housing.
The graph shows variation (versus the mean value of the control group-housed mice) for body weight changes, food intake and total visceral adipose fat mass weight, under standard or high fat diet. Individual housing (Ind) determined negative or positive energy balance depending on the diet being standard or high fat diet respectively. Dominance (Dom) determined a similar negative energy balance with both standard and high fat diet. Subordination (Sub) determined similar positive energy balance with both diets. However, body weight gain and feeding were similarly affected under standard and high fat diets while visceral fat pad mass increased with high fat diet only.

References

    1. Bjorntorp P. Do stress reactions cause abdominal obesity and comorbidities? Obes Rev. 2001;2:73–86. - PubMed
    1. McEwen BS. Protective and damaging effects of stress mediators. N Engl J Med. 1998;338:171–9. - PubMed
    1. Sapolsky RM, Romero LM, Munck AU. How do glucocorticoids influence stress responses? Integrating permissive, suppressive, stimulatory, and preparative actions. Endocr Rev. 2000;21:55–89. - PubMed
    1. Dallman MF, la Fleur SE, Pecoraro NC, Gomez F, Houshyar H, et al. Glucocorticoids-food intake, abdominal obesity, and wealthy nations in 2004. Endocrinology. 2004;145:2633–8. - PubMed
    1. Dallman MF, Pecoraro N, Akana SF, La Fleur SE, Gomez F, et al. Chronic stress and obesity: a new view of “comfort food”. Proc Natl Acad Sci U S A. 2003;100:11696–701. - PMC - PubMed

Publication types

MeSH terms