. 2009 Aug;30(8):2382-92.
doi: 10.1002/hbm.20678.

Blind identification of evoked human brain activity with independent component analysis of optical data

Affiliations

Blind identification of evoked human brain activity with independent component analysis of optical data

Joanne Markham et al. Hum Brain Mapp. 2009 Aug.

Abstract

Diffuse optical tomography (DOT) methods observe hemodynamics in the brain by measuring light transmission through the scalp, skull, and brain. Thus, separating signals due to heart pulsations, breathing movements, and systemic blood flow fluctuations from the desired brain functional responses is critical to the fidelity of the derived maps. Herein, we applied independent component analysis (ICA) to temporal signals obtained from a high-density DOT system used for functional mapping of the visual cortex. DOT measurements were taken over the occipital cortex of human adult subjects while they viewed stimuli designed to activate two spatially distinct areas of the visual cortex. ICA was able to extract clean functional hemodynamic signals and separate brain activity sources from hemodynamic fluctuations related to heart and breathing without knowledge of the stimulus paradigm. Furthermore, independent components were found defining distinct functional responses to each stimulus type. Images generated from single ICA components were comparable, with regard to spatial extent and resolution, to images from block averaging (with knowledge of the block stimulus paradigm). Both images and estimated time-series signals demonstrated that ICA was superior to principal component analysis in extracting the true event-evoked response signals. Our results suggest that ICA can extract the time courses and the corresponding spatial extent of functional responses in DOT imaging.


Figures

Figure 1
Figure 1
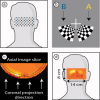
Experimental setup. (a) A schematic of the visual cortex imaging pad placed over the occipital cortex. Red dots are sources; blue squares are detectors. (b) Closeup of the two visual stimuli. Both extend over a polar angle of 70° and have an eccentricity of 0.5–1.7°. Checkerboards reversed at 10 Hz were presented for 10 s, and were separated by 31 s of 50% gray screen. (c) An axial image slice with a cortical activation. In this article, images are displayed as two‐dimensional coronal projections [as in (d)] of a cortical shell covering a depth 10 ± 5 mm below the scalp surface (the region between dotted lines with arrows showing direction of view). (d) Schematic showing placement of an activation image on a human subject. [Color figure can be viewed in the online issue, which is available at www.interscience.wiley.com.]
Figure 2
Figure 2
Steps in the calculation of response templates. (a) An image of an evoked response from stimulus B using block‐averaged raw data. The black box delineates the region selected for response B profile generation. (b) Averaged response from all subjects and all stimuli (red dots) along with a smoothed fitted curve (black solid line). (c,d) Templates for responses to stimuli A and B for one subject's presentation sequence. [Color figure can be viewed in the online issue, which is available at www.interscience.wiley.com.]
Figure 3
Figure 3
Representative ICA components and their Fourier transforms for Subject 1. (a) The average of all 212 measurement signals. (b) Fourier transform of (a) showing components occurring at many frequencies. (c) IC corresponding to a hemodynamic response for stimulus B. (d) Fourier transform of (c) with prominent low‐frequency content. (e) IC corresponding to cardiac pulse. (f) Fourier transform of (e) showing a strong frequency contribution at about 1.3 Hz. (g) IC corresponding to respiration. (h) Fourier transform of (g) with a strong frequency contribution at about 0.3 Hz.
Figure 4
Figure 4
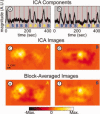
Results of ICA: Isolation of multiple stimulus responses for Subject 2 (arranged in two columns: A, B). (a) IC corresponding to the A stimulus type (r = 0.83 with template A) with the distinctive shape of a functional response. Red vertical lines represent stimulus onset, with letters showing which stimulus was presented in that interval (see Fig. 1). (b) IC corresponding to the B stimulus type (r = 0.86 with template B). (c,d) Images obtained for each IC. (e,f) Images obtained from block‐averaged raw signals. The two rows of images are similar with slightly less background activity in the ICA images. [Color figure can be viewed in the online issue, which is available at www.interscience.wiley.com.]
Figure 5
Figure 5
Results of ICA: Stimulus B in multiple subjects (arranged in three columns by subject). (ac) ICs corresponding to stimulus B found in three subjects (r = 0.81, 0.86, 0.58). Red vertical lines represent stimulus onset with letters showing which stimulus was presented in that interval. Note that the hemodynamic responses are easily distinguishable in each subject. (df) Images obtained for each IC. (gi) Images obtained from block‐averaged raw signals. Note the similarity between images in the two rows with less noise in the background for ICA images. [Color figure can be viewed in the online issue, which is available at www.interscience.wiley.com.]
Figure 6
Figure 6
Results of PCA: stimulus B in multiple subjects (arranged in three columns by subject). (ac) PCs with strongest correlation relative to stimulus B in each of the three subjects (r = 0.44, 0.49, 0.21). Amplitudes are arbitrary. Red vertical lines represent stimulus onset with letters, showing which stimulus was presented in that interval. Note that the signals are mixtures of stimulus responses and contaminants. (df) Images obtained for each PC. The images also show a mixture of different components; compare with images shown in Figure 5. [Color figure can be viewed in the online issue, which is available at www.interscience.wiley.com.]
Figure 7
Figure 7
Correlation coefficients. (a) The template for the response to stimulus (for Subject 2). (b) The IC with the highest correlation (0.83) to the template. (c) The PC with the highest correlation (0.68) to the template. (d) The plot of all correlations for Subject 2 and stimulus B; correlations were computed for all 24 ICs and all 24 PCs. ICs show a clear dichotomy between the functional response component (r = 0.86) and other components. (e). Correlation coefficients for all three subjects and both stimuli; correlation coefficients were computed for all ICs and PCs relative to both stimuli resulting in 178 values for each method. For ICA, the six stimulus response components have high correlation values (>0.58), whereas the remaining components have low values (<0.24). In contrast, only one PC has a high correlation value (r = 0.68). [Color figure can be viewed in the online issue, which is available at www.interscience.wiley.com.]

References

    1. Bartels A,Zeki S ( 2004): The chronoarchitecture of the human brain—Natural viewing conditions reveal a time‐based anatomy of the brain. NeuroImage 22: 419–433. - PubMed
    1. Bartels A,Zeki S ( 2005): Brain dynamics during natural viewing conditions–A new guide for mapping connectivity in vivo. NeuroImage 24: 339–349. - PubMed
    1. Beckmann CF,DeLuca M,Delvin JT,Smith SM ( 2005): Investigations into resting‐state connectivity using independent component analysis. Philos Trans R Soc Lond B Biol Sci 360: 1001–1013. - PMC - PubMed
    1. Bell AJ,Sejnowski TJ ( 1995): An information‐maximization approach to blind separation and blind deconvolution. Neural Comput 7: 1129–1159. - PubMed
    1. Belouchrani A,Abed‐Meraim K,Cardoso JF,Moulines D ( 1997): A blind source separation technique using second order statistics. IEEE Trans Signal Process 45: 434–444.

Publication types