. 2009 Feb;30(2):131-8.
doi: 10.1097/mao.0b013e318191bff8.

Entry of substances into perilymph through the bone of the otic capsule after intratympanic applications in guinea pigs: implications for local drug delivery in humans

Affiliations

Entry of substances into perilymph through the bone of the otic capsule after intratympanic applications in guinea pigs: implications for local drug delivery in humans

Anthony A Mikulec et al. Otol Neurotol. 2009 Feb.

Abstract

Hypothesis: Drugs applied to the middle ear enter perilymph through the bony otic capsule.

Background: Drugs applied intratympanically in humans are thought to enter the cochlea primarily through the round window membrane (RWM). Local drug treatments of the ear are commonly evaluated in rodent models. The otic capsule is much thinner at the cochlear apex in rodents than in humans. We therefore investigated whether drugs applied to the middle ear could enter perilymph through the otic capsule as well as through the RWM.

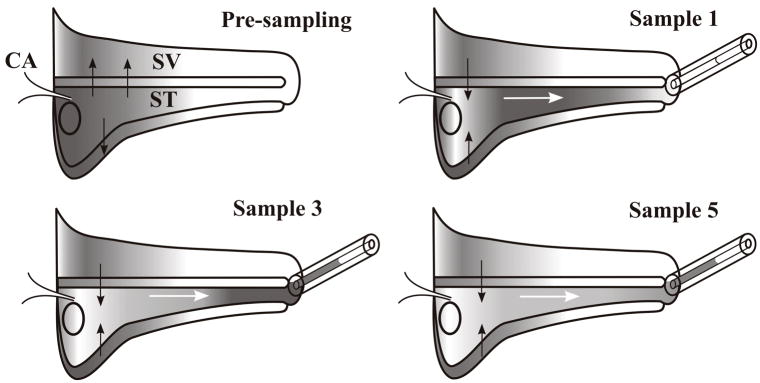
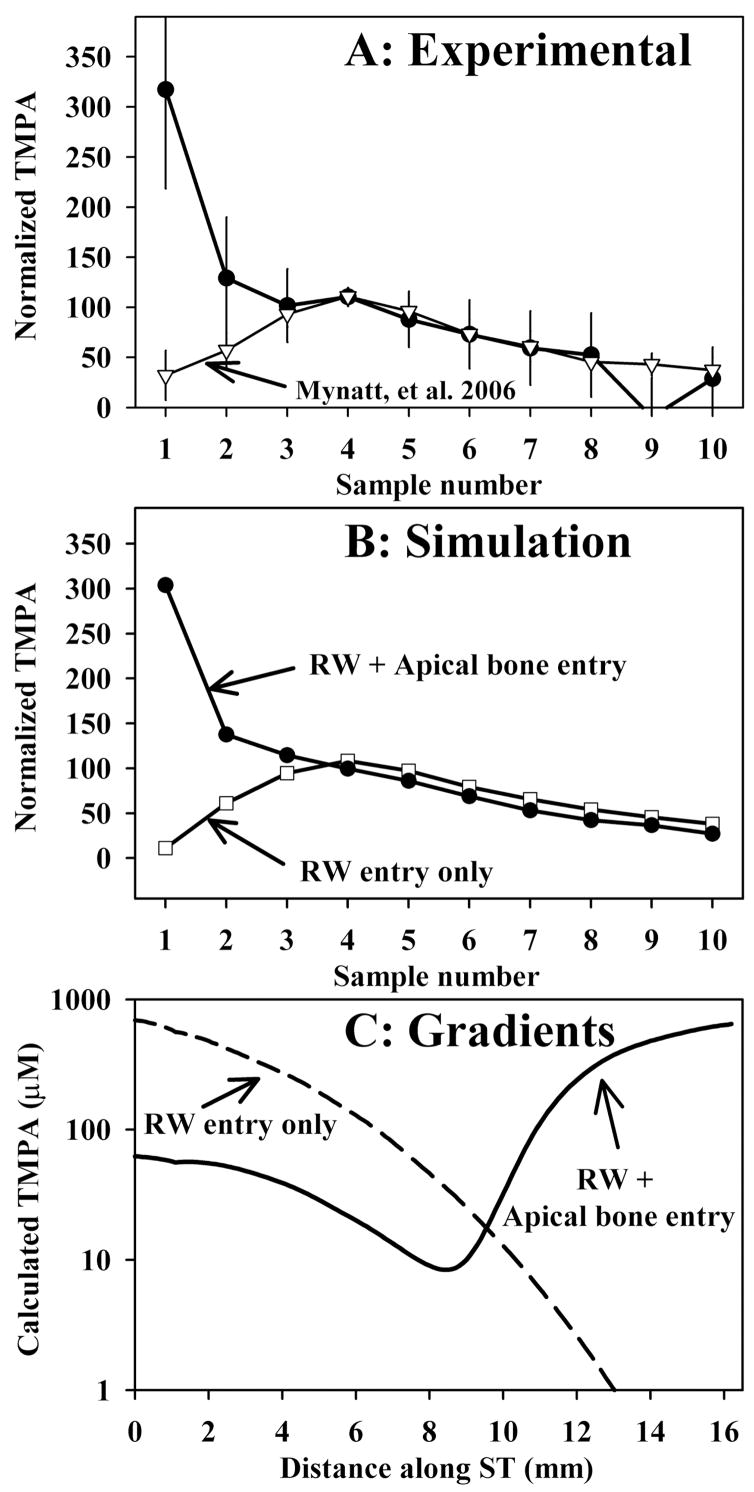
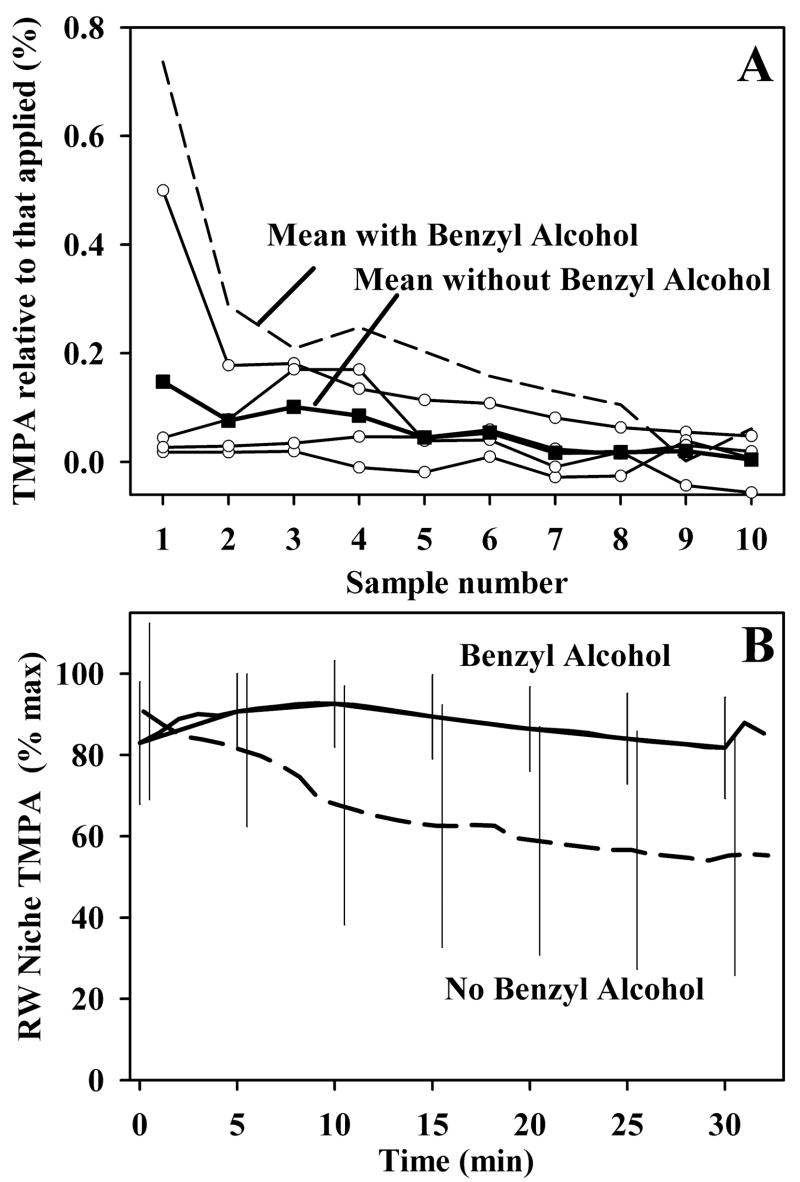
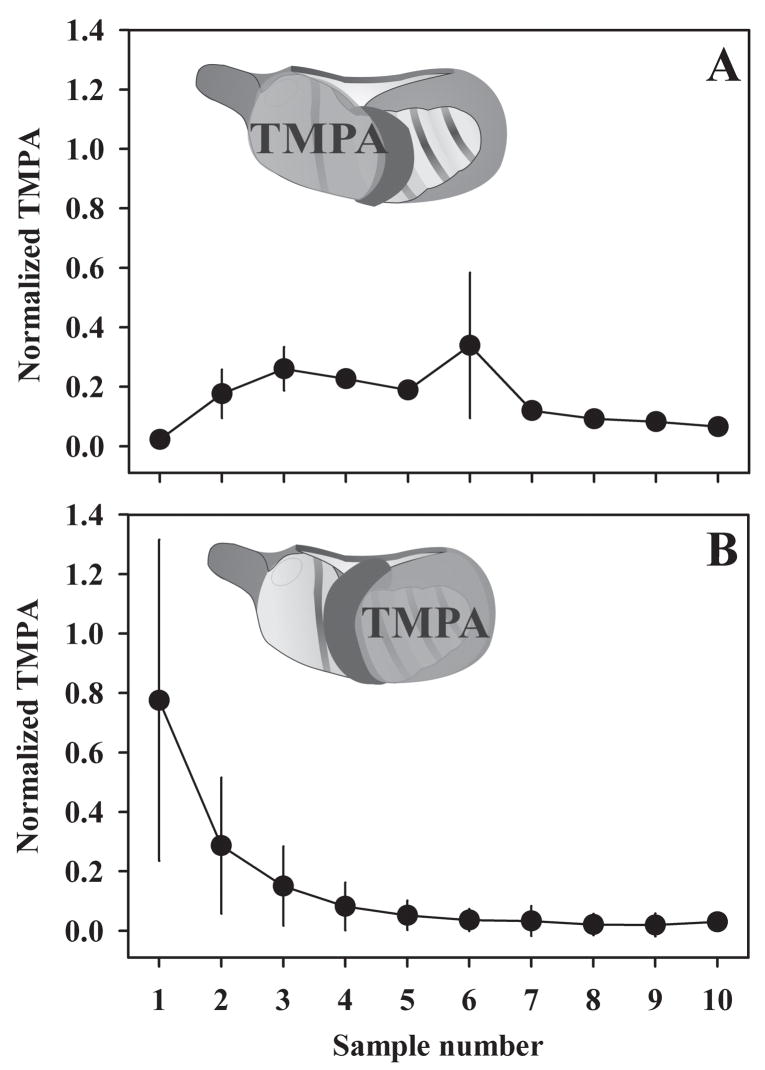
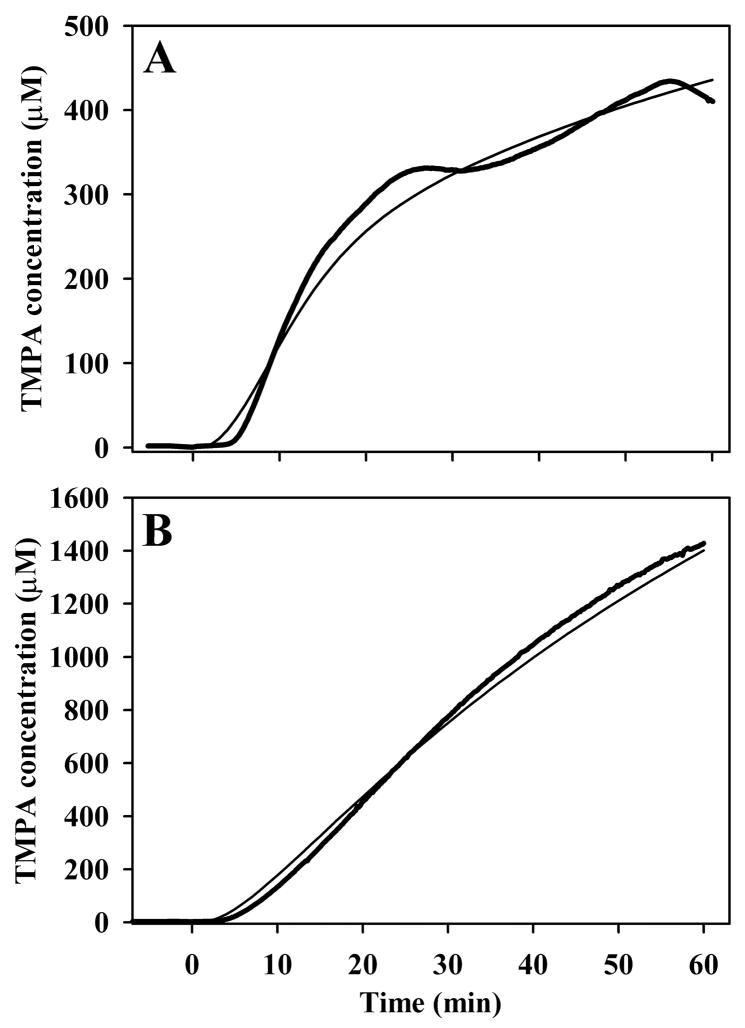
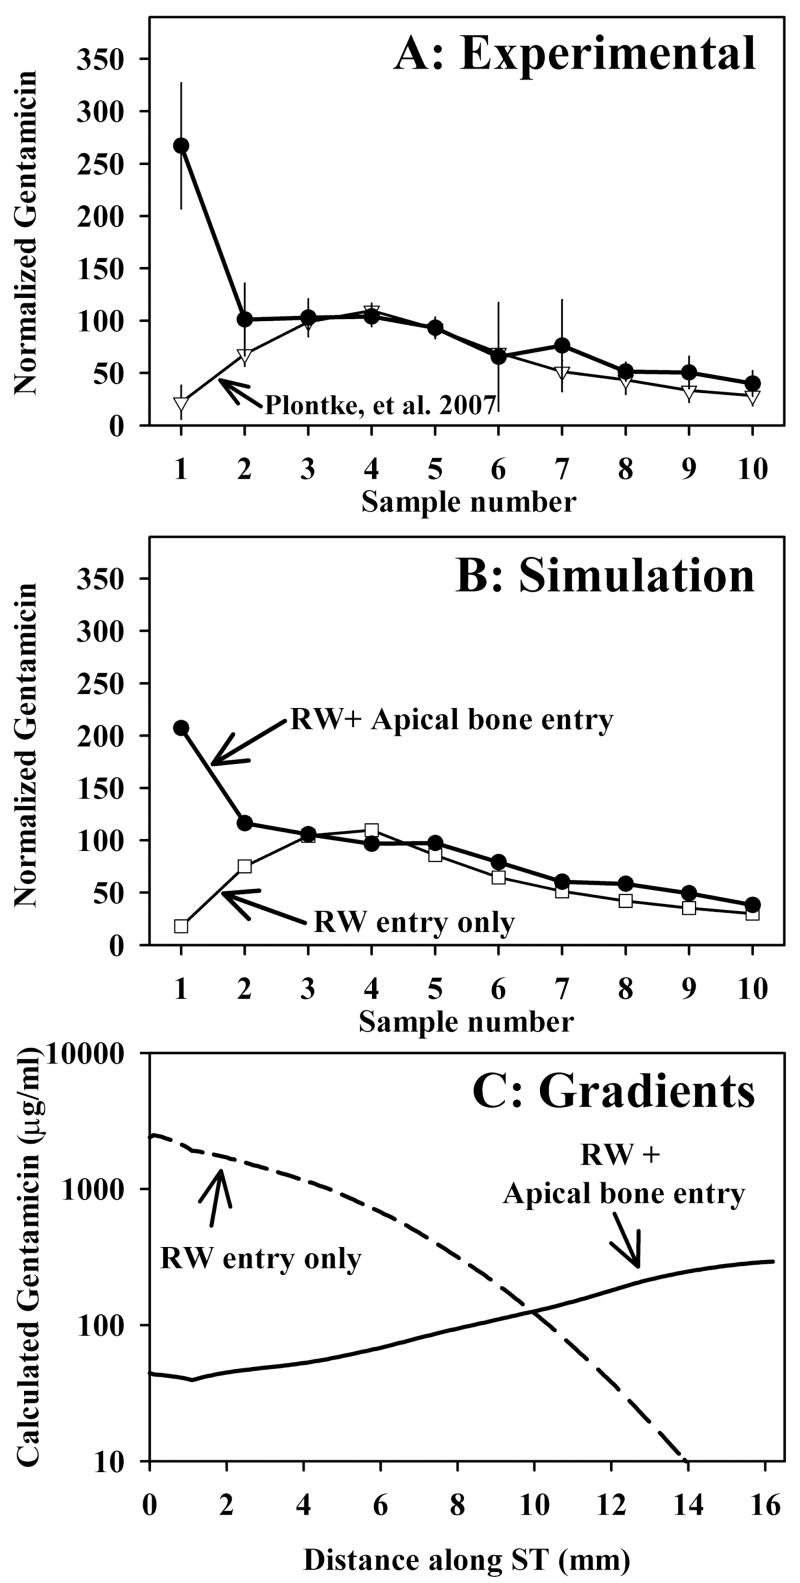
Methods: The distribution of gentamicin and the marker trimethylphenylammonium (TMPA) along the guinea pig cochlea was assessed with sequential apical perilymph sampling after 2 delivery paradigms that included 1) completely filling the tympanic bulla with solution and 2) applying the solution to the RWM only. In addition, TMPA entry into perilymph of the third turn was measured with ion-selective electrodes after the bulla was filled with TMPA solution.

Results: In application protocols that allowed drug to contact the otic capsule (by completely filling the bulla), markedly higher drug concentrations were found in the apical, low-frequency regions of the cochlea compared with drug applications to the RWM only.

Conclusion: Gentamicin and TMPA can enter perilymph of guinea pigs through the RWM and simultaneously through the bony otic capsule. Drug distribution along the cochlea after intratympanic applications will therefore be dramatically different in rodents and humans. Results obtained from intratympanic drug treatments of animals, in which the bulla is filled with solution and contacts the bony capsule of the cochlea, do not provide a good model for the situation in humans.


Figures

Figure 1
Figure 1
Schematic diagram of the uncoiled cochlea showing the sequential sampling of perilymph with a capillary tube from an apical cochleostomy. The pre-sampling condition shows the typical drug distribution following application to the basal turn. Solid arrows indicate the drug movements to regions of lower concentration, including scala vestibuli and other compartments of the cochlea, such as the spiral ligament and the modiolar spaces, represented by the compartment below scala tympani. When the apex is perforated, perilymph is displaced by cerebrospinal fluid entering through the cochlear aqueduct, causing volume flow, as indicated by white arrows. The first sample (Sample 1) consists of perilymph originating in the apical turns. Later samples (Samples 3–5) consist of perilymph originating from basal regions. Subsequent samples consist of CSF that has passed through the scala, accumulating drug from regions that were previously loaded, as shown by solid arrows. Abbreviations are ST: scala tympani; SV: scala vestibuli; CA: cochlear aqueduct.
Figure 2
Figure 2
Perilymph sampling results compared when TMPA was applied by completely filling the bulla with solution (Panel A: solid symbols, n=3, bars indicate SD) and with TMPA applied by irrigating solution across the RWM (Panel A; open symbols, n=8, from Mynatt et al.3) When TMPA was applied by filling the bulla with solution the initial samples taken from the apex were high, indicating relatively higher concentrations in the apical perilymph. In these experiments, the TMPA solution contained 10 mg/ml benzyl alcohol to increase RWM permeability. Sample concentrations from each experiment were normalized, setting the average of samples 3, 4 and 5 to 100. Panel B: Computer simulations of the sampling experiments from Panel A. Open symbols show simulations in which TMPA enters only through the RWM, with parameters adjusted to fit the data from experiments in which TMPA was applied by irrigation across the RWM. The curve with closed symbols in Panel B was calculated with identical parameters but includes an additional communication between the middle ear and perilymph (representing entry through the bone) for apical perilymph locations. Panel C: TMPA concentration gradients along scala tympani prior to sampling derived from the computer simulation of experiments. The two curves show the calculated distribution of TMPA along the cochlea that accounts for the sample concentrations observed under each protocol.
Figure 3
Figure 3
Panel A: Influence of benzyl alcohol on sample measurements. Curves with open symbols show samples taken in experiments without benzyl alcohol in the medium. The mean of the four curves is shown as solid symbols (solid symbols show the mean). Concentrations are shown normalized with respect to the applied concentration. TMPA levels were sometimes too low to reliably characterize the curve. The mean curve obtained when benzyl alcohol was included in the medium (dashed line, from Figure 2A) is shown for comparison. Lower levels of TMPA were found in the samples when benzyl alcohol was absent from the medium. Panel B Influence of benzyl alcohol on the rate of TMPA clearance from the middle ear. TMPA was measured in the round window niche with TMPA-selective electrodes. The curves show mean TMPA concentrations measured in the niche without benzyl alcohol in the medium (dashed curve, n=18) or with 10 mg/ml benzyl alcohol present in the medium (solid curve, n=8). Bars indicate standard deviation. The rate of TMPA clearance from the middle ear was significantly slower when benzyl alcohol was included in the medium.
Figure 4
Figure 4
Isolation entry components by applying TMPA solution separately to the apical and basal regions of the cochlea. A silicone “dam” (shown black in the inset schematic) was built to prevent fluid from spreading throughout the entire bulla. In experiments where applied fluid bathed the basal turns only (Panel A, n=2), initial sample concentrations (samples 1 and 2) were low, consistent with low TMPA levels in the apical turns. In experiments where applied fluid bathed the apical turns only (Panel B, n=2), initial sample concentrations were high, consistent with high TMPA levels in the apical turns. Concentrations were normalized as a percentage of the applied concentration. Bars indicate standard deviation.
Figure 5
Figure 5
Heavy curves in panels A and B show TMPA concentration measured with TMPA-selective electrodes in third turn of scala vestibuli in two separate experiments when the bulla was filled with 40 mM TMPA solution. In each case, TMPA concentration started increasing within 5 minutes of the application, which is far faster than expected if entry occurred only through the round window membrane. The fine curves show simulations of the experiments based on a communication between perilymph and the middle ear (representing entry through the bone) with half-times of 1100 mins (Panel A) and 360 minutes (Panel B) respectively.
Figure 6
Figure 6
Perilymph sampling results compared when gentamicin was applied by completely filling the bulla with solution (Panel A: solid symbols, n=4, bars indicate SD) and when gentamicin was applied by irrigating solution across the RWM (Panel A; open symbols, n=9, from Plontke et al. 2007 4). When gentamicin was applied by filling the bulla with solution, the initial samples taken from the apex were high, indicating relatively higher concentrations in the apical perilymph. Sample concentrations from each experiment were normalized, setting the average of samples 3, 4 and 5 to 100. Panel B: Computer simulations of the sampling experiments from Panel A. Open symbols show simulations in which gentamicin enters only through the RWM, with parameters adjusted to fit the data from experiments in which gentamicin was applied by irrigation across the RWM. The curve with closed symbols in Panel B was calculated with identical parameters but includes an additional communication between the middle ear and perilymph (representing entry through the bone) for apical perilymph locations. Panel C: Gentamicin concentration gradients along scala tympani prior to sampling derived from the computer simulation of experiments. The two curves show the calculated distribution of gentamicin along the cochlea that accounts for the sample concentrations observed under each protocol.

References

    1. Salt AN, Ma Y. Quantification of solute entry into cochlear perilymph through the round window membrane. Hear Res. 2001;154:88–97. - PubMed
    1. Salt AN, Kellner C, Hale S. Contamination of perilymph sampled from the basal cochlear turn with cerebrospinal fluid. Hear Res. 2003;182:24–33. - PubMed
    1. Mynatt R, Hale SA, Gill RM, Plontke SKR, Salt AN. Demonstration of a longitudinal concentration gradient along scala tympani by sequential sampling of perilymph from the cochlear apex. J Assoc Res Otolaryngol. 2006;7:182–193. - PMC - PubMed
    1. Plontke SK, Mynatt R, Gill RM, Salt AN. Concentration gradient along scala tympani following the local application of gentamicin to the round window membrane. Laryngoscope. 2007;117:1191–1198. - PMC - PubMed
    1. Plontke SK, Biegner T, Kammerer B, Delabar U, Salt AN. Dexamethasone concentration gradients along scala tympani after application to the round window membrane. Otology & Neurotology. 2008;29:401–406. - PMC - PubMed

Publication types

MeSH terms