Image-based models of cardiac structure with applications in arrhythmia and defibrillation studies
- PMID: 19181330
- PMCID: PMC2819337
- DOI: 10.1016/j.jelectrocard.2008.12.003
Image-based models of cardiac structure with applications in arrhythmia and defibrillation studies
Abstract
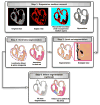
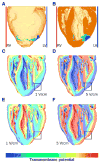
The objective of this article is to present a set of methods for constructing realistic computational models of cardiac structure from high-resolution structural and diffusion tensor magnetic resonance images and to demonstrate the applicability of the models in simulation studies. The structural image is segmented to identify various regions such as normal myocardium, ventricles, and infarct. A finite element mesh is generated from the processed structural data, and fiber orientations are assigned to the elements. The Purkinje system, when visible, is modeled using linear elements that interconnect a set of manually identified points. The methods were applied to construct 2 different models; and 2 simulation studies, which demonstrate the applicability of the models in the analysis of arrhythmia and defibrillation, were performed. The models represent cardiac structure with unprecedented detail for simulation studies.
Figures


Similar articles
-
Image-based models of cardiac structure in health and disease.Wiley Interdiscip Rev Syst Biol Med. 2010 Jul-Aug;2(4):489-506. doi: 10.1002/wsbm.76. Wiley Interdiscip Rev Syst Biol Med. 2010. PMID: 20582162 Free PMC article. Review.
-
Image based modeling of defibrillation in children.Conf Proc IEEE Eng Med Biol Soc. 2006;2006:2564-7. doi: 10.1109/IEMBS.2006.259549. Conf Proc IEEE Eng Med Biol Soc. 2006. PMID: 17946966 Clinical Trial.
-
An atlas-based geometry pipeline for cardiac Hermite model construction and diffusion tensor reorientation.Med Image Anal. 2012 Aug;16(6):1130-41. doi: 10.1016/j.media.2012.06.005. Epub 2012 Jul 6. Med Image Anal. 2012. PMID: 22841777 Free PMC article.
-
Computational rabbit models to investigate the initiation, perpetuation, and termination of ventricular arrhythmia.Prog Biophys Mol Biol. 2016 Jul;121(2):185-94. doi: 10.1016/j.pbiomolbio.2016.06.004. Epub 2016 Jun 19. Prog Biophys Mol Biol. 2016. PMID: 27334789 Free PMC article. Review.
-
Normal and pathological NCAT image and phantom data based on physiologically realistic left ventricle finite-element models.IEEE Trans Med Imaging. 2006 Dec;25(12):1604-16. doi: 10.1109/tmi.2006.884213. IEEE Trans Med Imaging. 2006. PMID: 17167995
Cited by
-
Optogenetic defibrillation terminates ventricular arrhythmia in mouse hearts and human simulations.J Clin Invest. 2016 Oct 3;126(10):3894-3904. doi: 10.1172/JCI88950. Epub 2016 Sep 12. J Clin Invest. 2016. PMID: 27617859 Free PMC article.
-
Optimisation of ionic models to fit tissue action potentials: application to 3D atrial modelling.Comput Math Methods Med. 2013;2013:951234. doi: 10.1155/2013/951234. Epub 2013 Jul 1. Comput Math Methods Med. 2013. PMID: 23935704 Free PMC article.
-
Susceptibility to arrhythmia in the infarcted heart depends on myofibroblast density.Biophys J. 2011 Sep 21;101(6):1307-15. doi: 10.1016/j.bpj.2011.08.009. Epub 2011 Sep 20. Biophys J. 2011. PMID: 21943411 Free PMC article.
-
Unstable QT interval dynamics precedes ventricular tachycardia onset in patients with acute myocardial infarction: a novel approach to detect instability in QT interval dynamics from clinical ECG.Circ Arrhythm Electrophysiol. 2011 Dec;4(6):858-66. doi: 10.1161/CIRCEP.110.961763. Epub 2011 Aug 14. Circ Arrhythm Electrophysiol. 2011. PMID: 21841208 Free PMC article.
-
Using personalized computer models to custom-tailor ablation procedures for atrial fibrillation patients: are we there yet?Expert Rev Cardiovasc Ther. 2017 May;15(5):339-341. doi: 10.1080/14779072.2017.1317593. Epub 2017 Apr 17. Expert Rev Cardiovasc Ther. 2017. PMID: 28395557 Free PMC article. No abstract available.
References
-
- Hunter PJ, Pullan AJ, Smaill BH. Modeling total heart function. Annu Rev Biomed Eng. 2003;5:147. - PubMed
-
- Helm PA, Younes L, Beg MF, et al. Evidence of structural remodeling in the dyssynchronous failing heart. Circ Res. 2006;98:125. - PubMed
-
- Suri JS, Kamaledin SS, Singh S. Advanced algorithmic approaches to medical image segmentation: state of the art applications in cardiology, neurology, mammography, and pathology. London: Springer-Verlag; 2002.
-
- Ibanez L, Schroeder W, Ng L, Cates J. The Itk software guide: the insight segmentation and registration toolkit. Clifton Park, New York: Kitware Inc; 2003.
Publication types
MeSH terms
Grants and funding
LinkOut - more resources
Full Text Sources
Other Literature Sources
Medical

