. 2009 Apr;37(5):e35.
doi: 10.1093/nar/gkp028. Epub 2009 Jan 30.

A rapid simple approach to quantify chromosome conformation capture

Affiliations

A rapid simple approach to quantify chromosome conformation capture

M Abou El Hassan et al. Nucleic Acids Res. 2009 Apr.

Abstract

Chromosome conformation capture (3C) is a powerful tool to study DNA looping. The procedure generates chimeric DNA templates after ligation of restriction enzyme fragments juxtaposed in vivo by looping. These unique ligation products (ULPs) are typically quantified by gel-based methods, which are practically inefficient. Taqman probes may be used, but are expensive. Cycle threshold (Ct) determined using SYBR Green, an inexpensive alternative, is hampered by non-specific products and/or background fluorescence, both due to high template/ULP ratio. SYBR Green melting curve analysis (MCA) is a well-known qualitative tool for assessing PCR specificity. Here we present for the first time MCA as a quantitative tool (qMCA) to compare template concentrations across different samples and apply it to 3C to assess looping among remote elements identified by STAT1 and IRF1 ChIP-chip at the interferon-gamma responsive CIITA and SOCS1 loci. This rapid, inexpensive approach provided highly reproducible identification and quantification of ULPs over a significant linear range. Therefore, qMCA is a robust method to assess chromatin looping in vivo, and overcomes several drawbacks associated with other approaches. Our data suggest that basal and induced looping is a involving remote enhancers is a common mechanism at IFNgamma-regulated targets.


Figures

Figure 1.
Figure 1.
3C at the CIITA locus. (A) The 3C procedure. At this hypothetical locus, sites X and Z, but not Y, interact. The X:Y connection is formaldehyde-fixed, digested with a suitable restriction enzyme (E, NcoI in case of the CIITA locus) and intra-molecular ligation, favored over inter-molecular ligation by diluting the sample, produces ULPs (X:Z but not X:Y or Y:Z). For simplicity, only one of the potential ULPs is shown. ULPs are detected by PCR using specific primers (black arrows). (B) The CIITA locus. A 197 kb segment encompassing chr16:10 810 556–11 007 077) is shown. The four tracks in the browser snapshot display ChIP-chip profiles of IFNγ induced binding of STAT1 (Track1) and IRF1 (Track 2), and the location of Refseq genes (Track 3) or BACs (Track 4). BAC (CTD–2577P18, indicated as asterisk) was used in this study. Distance in kb from pIV of various sites and the Nco I fragments used to study bULPs or gULPs (a–e) are indicated above or below the browser window, respectively.
Figure 2.
Figure 2.
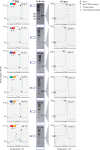
MCA specifically detects bULPs. CTD–2577P18 BAC, covering the CIITA locus, was Nco I digested, ligated at high concentration, and bULPs generated through ligation of the indicated Nco I fragments were examined using PCR and MCA performed. Plots on the left show the first MCA, and those on the right show the second MCA after purification in 1.5% agarose gels, displayed in the centre (expected fragment size is indicated at the top of the gel). Half of the gel-purified DNA was used for sequencing and a check mark below the gel indicates that the expected sequence was obtained. Black and red diamonds indicate peaks obtained with the bULP or no-template control (NTC), respectively, and their Tm is indicated. Single dagger signs indicate primer dimers in two samples, and a double dagger indicates another non-specific PCR product in one sample.
Figure 3.
Figure 3.
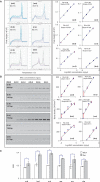
Correlation between bULP concentration and melting peak height or gel band density. CTD–2577P18 BAC was NcoI digested, ligated and 10-fold serially diluted for PCR amplification and MCA. All PCR products were subsequently quantified on 1.5% agarose gels. (A) Left panel: Representative MCA of bULPs with the indicated Tm values. Right panel: Representative standard curves of peak height against log concentration of BAC standard samples. (B) Left panel: Representative agarose gel images of bULP PCR products. Right panel: Representative standard curves of band densities against log concentration of calibration samples. R2 values and slopes are indicated. Red lines highlight the residuals (difference) between observed and predicted values. (C) SSR of MCA and gel-based standard curves for all tested bULPs. Values are the mean (n = 3) ± SD. P-values were calculated by Student's t-test: *P < 0.05; **P < 0.01.
Figure 4.
Figure 4.
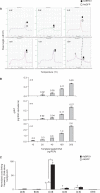
Effects of genomic DNA on amplification of bULPs PCR. (A) gDNA does not interfere with PCR specificity. CTD–2577P18 BAC was NcoI digested, ligated and diluted to 0.4 ng/μl alone or with 200ng NcoI digested SW13 DNA. Products were analyzed by MCA (left) and sized on 1.5% agarose gel (right). Tables below the agarose gels indicate the different combinations of BAC and gDNA and the colored diamonds and triangles refer to the melting curve on the corresponding MCA plot. MCA plots are labeled with the ULP name and Tm. Single dagger signs indicate primer dimers, and a double dagger indicates another non-specific PCR product. (B) Standard curves of melting peak height against log concentration of BAC alone (blue) or with 200 ng gDNA (red). Curves were constructed from three different data sets. R2 values and slopes are indicated in black and red for BAC alone or plus gDNA, respectively.
Figure 5.
Figure 5.
ULPs from HeLa cells. HeLa cells were treated with IFNγ for 6 h, lysed, cross-linked and NcoI digested. Chromatin was purified after overnight incubation with or without T4 DNA ligase. MCA for different gULPs generated low background fluorescence and peaks of the expected Tm (black diamond) that were not detected with unligated cross-linked chromatin (red diamond).
Figure 6.
Figure 6.
gULPs from SW13 cells and quantification of looping at CIITA. (A) MCA plots of gULPs generated from SW13 cells transduced with AdGFP or AdBRG1 then exposed to IFNγ for 6 h. Melting peaks appeared at similar Tm values as the corresponding bULPs (Figure 3A). A dashed line indicates the Tm of the d:e gULP, which was hardly detectable. The dagger sign indicates primer dimers. (B) Titration of the gULPs a:d c:d and a:e. 3C DNA from the BRG1-reconstituted cells was serially diluted in the range of 0.5–50 ng/μl ligated DNA (2–200 ng per PCR) to determine their linear range of PCR amplification. NcoI digested unligated DNA was added to all dilutions to equalize total DNA to 200 ng/PCR. gULP concentration was calculated in BAC equivalents according to Equation (2) (see Material and Methods section) and was plotted against the concentration of template ligated DNA. Values are the mean of two independent experiments ± range. (C) Example of DNA looping frequencies at the CIITA locus. Peak heights from (A) were used to calculate the crosslinking frequencies between DNA sites as explained in Materials and methods section. Values are the mean (n ≥ 3) ± SD. Asterisk indicates significant difference between AdBRG1 and AdGFP while dagger indicates significant basal interaction compared to the negative control b:d. Both asterisk and dagger were calculated by ANOVA followed by Fisher's test.
Figure 7.
Figure 7.
Identification of looping at SOCS1. (A) The SOCS1 locus. A 141 kb segment encompassing chr16:11 199 000–11 339 900 is shown. Tracks are labeled as in Figure 1B. The BAC RP11-697G17 (indicated as number sign) was used in the 3C experiment. Distances of various sites in kilo base pairs from the SOCS1 promoter are indicated by red arrows above the browser window and the EcoRI fragments used to study gULPs (v–z) are indicated by boxes below. (B) Agarose gels (fragment name and expected size are indicated at the top of the gel) and MCA plots (Tm values indicated at the top of the plot) of gULPs generated from HeLa cells left untreated (open square) or exposed to IFNγ for 6 h (solid square). The double dagger sign indicates a non-specific product. (C) DNA looping frequencies at the SOCS1 locus. Peak heights from (B) were used to calculate the crosslinking frequencies between DNA sites. Values are the mean (n ≥ 3) ± SD. The dagger sign indicates a significant difference (P < 0.05) from the background looping at w:x, and asterisk indicates significant difference (P < 0.05) between untreated and IFNγ treated samples. P values were calculated by ANOVA followed by Fisher test.

Similar articles

Cited by

References

    1. Mostoslavsky R, Alt FW, Bassing CH. Chromatin dynamics and locus accessibility in the immune system. Nat. Immunol. 2003;4:603–606. - PubMed
    1. de Laat W, Grosveld F. Inter-chromosomal gene regulation in the mammalian cell nucleus. Curr. Opin. Genet. Dev. 2007;17:456–464. - PubMed
    1. Williams RR, Broad S, Sheer D, Ragoussis J. Subchromosomal positioning of the epidermal differentiation complex (EDC) in keratinocyte and lymphoblast interphase nuclei. Exp. Cell. Res. 2002;272:163–175. - PubMed
    1. Volpi EV, Chevret E, Jones T, Vatcheva R, Williamson J, Beck S, Campbell RD, Goldsworthy M, Powis SH, Ragoussis J, et al. Large-scale chromatin organization of the major histocompatibility complex and other regions of human chromosome 6 and its response to interferon in interphase nuclei. J. Cell Sci. 2000;113(Pt 9):1565–1576. - PubMed
    1. Morey C, Da Silva NR, Perry P, Bickmore WA. Nuclear reorganisation and chromatin decondensation are conserved, but distinct, mechanisms linked to Hox gene activation. Development. 2007;134:909–919. - PubMed

Publication types