. 2009 Feb 10;106(6):1748-53.
doi: 10.1073/pnas.0807193106. Epub 2009 Jan 30.

Type III restriction enzymes communicate in 1D without looping between their target sites

Affiliations

Type III restriction enzymes communicate in 1D without looping between their target sites

Subramanian P Ramanathan et al. Proc Natl Acad Sci U S A. .

Abstract

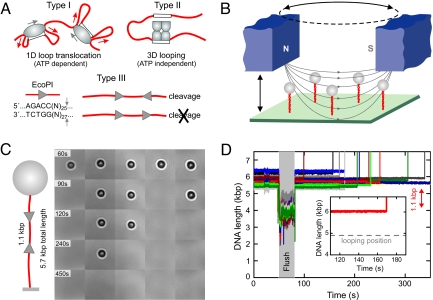
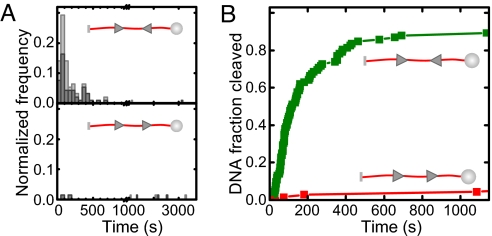
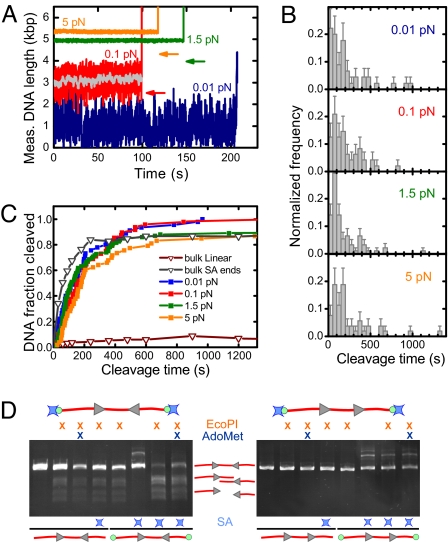
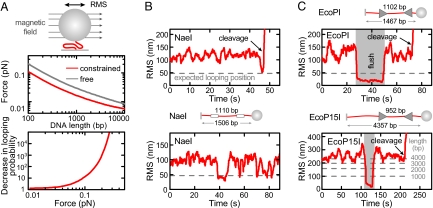
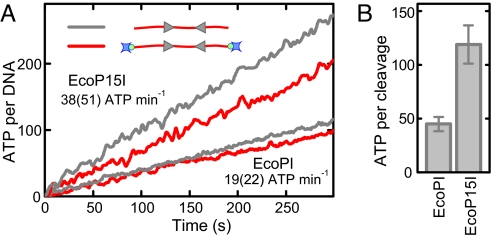
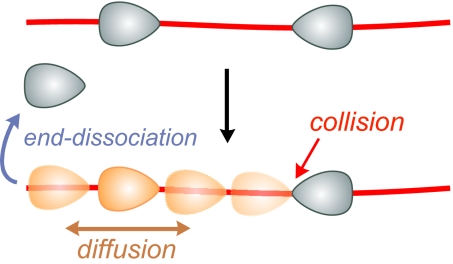
To cleave DNA, Type III restriction enzymes must communicate the relative orientation of two asymmetric recognition sites over hundreds of base pairs. The basis of this long-distance communication, for which ATP hydrolysis by their helicase domains is required, is poorly understood. Several conflicting DNA-looping mechanisms have been proposed, driven either by active DNA translocation or passive 3D diffusion. Using single-molecule DNA stretching in combination with bulk-solution assays, we provide evidence that looping is both highly unlikely and unnecessary, and that communication is strictly confined to a 1D route. Integrating our results with previous data, a simple communication scheme is concluded based on 1D diffusion along DNA.


Conflict of interest statement

The authors declare no conflict of interest.

Figures

Fig. 1.
Fig. 1.
Modes of communication between two distant enzyme sites and highly parallel single DNA molecule detection assay. (A) Communication between distant DNA target sites by restriction enzymes. Type I REs use ATP-driven translocation to pull in large DNA loops (red arrows). Establishment of intersite contacts by Type II REs occurs mainly by passive, diffusive 3D looping. Type III REs require two asymmetric sites in an indirectly repeated orientation to cleave DNA approximately 25 bp downstream at one of the two sites (small gray arrows). (B) Sketch of the parallel magnetic tweezers setup. (C) Real-time DNA cleavage experiment with EcoPI on 5 DNA molecules (sketch on the Left) where the two 1.1-kb spaced enzyme sites are oriented in a HtH fashion (F = 1.5 pN). DNA cleavage is seen as disappearance of the 1-μm sized magnetic microspheres (black/white circles). (D) Simultaneous tracking of 15 DNA molecules during cleavage by EcoPI. DNA contour lengths have been corrected to account for incomplete stretching at F = 1.5 pN. During the period marked “flush”, enzyme is introduced into the flow cell. Subsequently, DNA molecules are cleaved and the microsphere lost, as seen by the apparent rapid DNA lengthening. Inset: Enlarged view of a time trace for a single DNA, showing the constant length throughout the reaction.
Fig. 2.
Fig. 2.
Specificity of DNA cleavage by EcoPI in the single-molecule assay. (A) Histograms of the cleavage times for a HtH substrate (Upper) and for a HtT substrate (Lower) recorded at 1.5 pN. Cleavage time is the period between start of the enzyme flush until cleavage was observed (Fig. 1D). Counts were normalized by the total number N of molecules investigated with n = 92 for the HtH and n = 68 for the HtT substrate. Light gray bars are for all molecules, gray bars for the intact fraction only. (B) Cleavage kinetics for the HtH and the HtT substrate obtained by integrating the histograms in A.
Fig. 3.
Fig. 3.
Force dependence of DNA cleavage by EcoPI. (A) Individual time traces for the HtH substrate taken at 0.01 pN, 0.1 pN, 1.5 pN, and 5 pN. The arrows indicate the expected apparent DNA length for the given force if a loop between the two EcoPI sites would have been formed. The gray trace was obtained by smoothing the 0.1 pN trace (red) with a 1-s sliding average window. (B) Histograms of the cleavage times for the HtH substrate measured at 0.01 pN (n = 45), 0.1 pN (n = 48), 1.5 pN (n = 92), and 5 pN (n = 53). (C) Cleavage kinetics for the HtH substrate at the four forces measured compared with the cleavage kinetics obtained in bulk experiments. For the bulk data the same substrate was used as in the tweezers experiments, which was either simply linearized or linearized with streptavidin (SA) attached to the ends (see below). (D) Bulk DNA cleavage measured after one hour using 15 nM EcoPI on 2 nM HtH (Left) or HtT (Right) linear DNA, with or without biotin ends (green circles). Where indicated, streptavidin (blue stars) and 100 μM AdoMet were included. DNA samples were separated by agarose gel electrophoresis.
Fig. 4.
Fig. 4.
Absence of looping for DNA in random coil configuration. (A) Residual entropic force for a 1-μm microsphere as a function of DNA length (25) and probability decrease for formation of a 1,000-bp loop as a function of force (22). Calculations have been done for a microsphere which can either rotate in all directions (free) or only around one axis parallel to the surface (constrained), as achieved with an applied magnetic field (see sketch). Forces are obtained as described in ref. using the DNA extension from simulations. (B) Detection of DNA looping for the Type II RE NaeI by TPM with a constrained microsphere. The sketch illustrates the DNA construct. DNA looping by NaeI is seen as a large decrease in the RMS amplitude of the lateral fluctuations. The gray dashed line shows the expected RMS amplitude after a loop is formed, as obtained from simulations. The graphs show looping just before DNA cleavage (Upper) and repetitive looping (Lower). The time resolution was approximately 2 s because of 2-s sliding window averaging. (C) DNA cleavage by EcoPI and EcoP15I on randomly coiled DNA. Constrained TPM measurements were carried out using either short 1.5-kb constructs or the longer constructs from the force experiments (see sketches; Fig. 1 and Fig. S3). Time resolution for the short constructs is approximately 2 s and for the long constructs is approximately 10 s.
Fig. 5.
Fig. 5.
ATPase activity of Type III REs. (A) Kinetics of ATP hydrolysis (per DNA) for EcoPI and EcoP15I measured for capped and uncapped HtH substrates at 1 mM ATP. The ATPase rates indicated are for capped and uncapped (in brackets) substrates. (B) Average number of ATP molecules required to cleave a DNA molecule obtained by dividing the ATPase rate by the cleavage rate measured under the same conditions (Fig. S4).
Fig. 6.
Fig. 6.
Model for the intersite communication by Type III REs based on 1D diffusion. The enzymes bind to DNA in an orientation determined by their binding site. After diffusion is triggered, one enzyme slides bidirectionally along the DNA and either falls off at a DNA end or encounters a second enzyme where, depending on its orientation, DNA cleavage may be triggered.

Similar articles

Cited by

References

    1. Halford SE, Welsh AJ, Szczelkun MD. Enzyme-mediated DNA looping. Annu Rev Biophys Biomol Struct. 2004;33:1–24. - PubMed
    1. Iyer RR, Pluciennik A, Burdett V, Modrich PL. DNA mismatch repair: Functions and mechanisms. Chem Rev. 2006;106:302–323. - PubMed
    1. Studier FW, Bandyopadhyay PK. Model for how type I restriction enzymes select cleavage sites in DNA. Proc Natl Acad Sci USA. 1988;85:4677–4681. - PMC - PubMed
    1. Meisel A, Mackeldanz P, Bickle TA, Krüger DH, Schroeder C. Type III restriction endonucleases translocate DNA in a reaction driven by recognition site-specific ATP hydrolysis. EMBO J. 1995;14:2958–2966. - PMC - PubMed
    1. Gowers DM, Bellamy SRW, Halford SE. One recognition sequence, seven restriction enzymes, five reaction mechanisms. Nucleic Acids Res. 2004;32:3469–3479. - PMC - PubMed

Publication types

Substances

LinkOut - more resources