

Refusal bias in HIV prevalence estimates from nationally representative seroprevalence surveys
- PMID: 19182677
- PMCID: PMC2695508
- DOI: 10.1097/QAD.0b013e3283269e13
Refusal bias in HIV prevalence estimates from nationally representative seroprevalence surveys
Abstract
Objectives: To assess the relationship between prior knowledge of one's HIV status and the likelihood to refuse HIV testing in populations-based surveys and explore its potential for producing bias in HIV prevalence estimates.
Methods: Using longitudinal survey data from Malawi, we estimate the relationship between prior knowledge of HIV-positive status and subsequent refusal of an HIV test. We use that parameter to develop a heuristic model of refusal bias that is applied to six Demographic and Health Surveys, in which refusal by HIV status is not observed. The model only adjusts for refusal bias conditional on a completed interview.
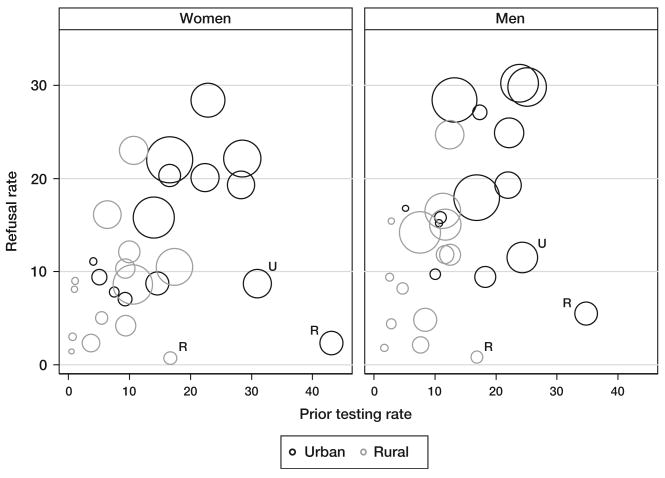
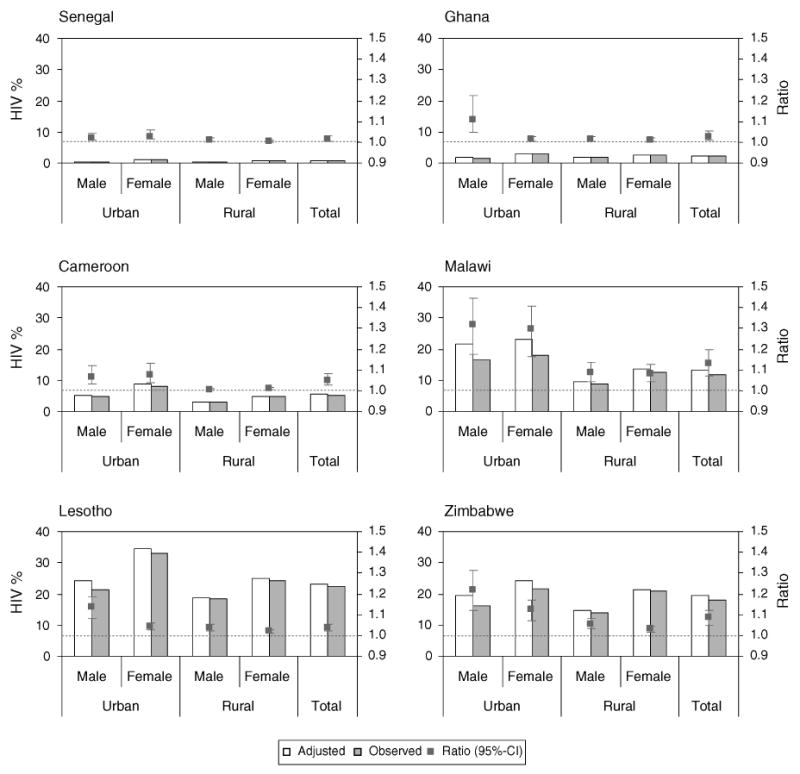
Results: Ecologically, HIV prevalence, prior testing rates and refusal for HIV testing are highly correlated. Malawian data further suggest that amongst individuals who know their status, HIV-positive individuals are 4.62 (95% confidence interval, 2.60-8.21) times more likely to refuse testing than HIV-negative ones. On the basis of that parameter and other inputs from the Demographic and Health Surveys, our model predicts downward bias in national HIV prevalence estimates ranging from 1.5% (95% confidence interval, 0.7-2.9) for Senegal to 13.3% (95% confidence interval, 7.2-19.6) for Malawi. In absolute terms, bias in HIV prevalence estimates is negligible for Senegal but 1.6 (95% confidence interval, 0.8-2.3) percentage points for Malawi. Downward bias is more severe in urban populations. Because refusal rates are higher in men, seroprevalence surveys also tend to overestimate the female-to-male ratio of infections.
Conclusion: Prior knowledge of HIV status informs decisions to participate in seroprevalence surveys. Informed refusals may produce bias in estimates of HIV prevalence and the sex ratio of infections.
Figures
References
-
- Kigadye RM, Klokke A, Nicoll A, Nyamuryekung'e KM, Borgdorff M, Barongo L, et al. Sentinel surveillance for HIV-1 among pregnant women in a developing country: 3 years' experience and comparison with a population serosurvey. AIDS. 1993;7:849–855. - PubMed
-
- Fylkesnes K, Ndhlovu Z, Kasumba K, Mubanga Musonda R, Sichone M. Studying dynamics of the HIV epidemic: population-based data compared with sentinel surveillance in Zambia. AIDS. 1998;12:1227–1234. - PubMed
-
- Glynn JR, Buve A, Carael M, Zaba B. Adjustment of antenatal clinic HIV surveillance data for HIV-associated differences in fertility. AIDS. 1999;13:1598–1599. - PubMed
-
- Zaba B, Boerma T, White R. Monitoring the AIDS epidemic using HIV prevalence data among young women attending antenatal clinics: prospects and problems. AIDS. 2000;14:1633–1645. - PubMed
-
- Glynn JR, Buve A, Carael M, Musonda RM, Kahindo M, Macauley I, et al. Factors influencing the difference in HIV prevalence between antenatal clinic and general population in sub-Saharan Africa. AIDS. 2001;15:1717–1725. - PubMed
Publication types
MeSH terms
Grants and funding
LinkOut - more resources
Full Text Sources
Medical
